
T H E C I T Y OF N E W Y O R K
D E P A R T M E N T O F F I N A N C E
D I V I S I O N O F T A X P O L I C Y & D A T A A N A L Y T I C S
ANNUAL REPORT OF THE
NEW YORK CITY
REAL PROPERTY TAX
FISCAL YEAR 2023
ERIC ADAMS, MAYOR PRESTON NIBLACK, COMMISSIONER

ANNUAL REPORT
OF THE
NEW YORK CITY
REAL PROPERTY TAX
FISCAL YEAR 2023
ERIC ADAMS
MAYOR
PRESTON NIBLACK
COMMISSIONER
REPORT PREPARED BY THE
DIVISION OF TAX POLICY & DATA ANALYTICS
MAY 2023
Table of Contents
Fast Facts…….…… ...................................................................................................................... 1
FY 2023 Summary…….…… ....................................................................................................... 3
Part I: Current Year Profiles ...................................................................................................... 5
Table 1: Market and Assessed Value, Taxable Properties by Property Type
and Borough. ..................................................................................................................... 6
Table 2: Tax Dollar Value of Real Property Tax Exemptions by Property
Type and Borough ........................................................................................................... 12
Table 3: Tax Dollar Value of Real Property Tax Exemptions by Exemption
Type and Borough ........................................................................................................... 18
Part II: Tax Levy ………………………………………………………………….……… ... 31
Table 4: Reconciliation of Assessment Roll, Tax Levy and Net Levy Billed
by Property Type ............................................................................................................ 33
Table 5: Abatements by Property Type and Abatement Type ................................................... 35
Part III: Office Buildings……..…………………………………………………….…… ..... 37
Table 6: Office Building Profile by Borough ............................................................................... 38
Table 7: Office Building Profile for Selected Areas ..................................................................... 39
Table 8: Office Building Profile for Selected Areas by Office Building Class ............................ 40
Table 9: Market and Assessed Value, Selected Areas, by Office Building Class ........................ 41
Part IV: Home Sales……..…………………………………………………….…… ............. 43
Table 10: Home Sales, CY 2022 by Quarter ................................................................................ 44
Table 11: Single-family Home Sales Transactions and Prices by Borough,
CY 2003 – CY 2022 ..................................................................................................... 45
Table 12: Citywide Home Sales by Type of Property, CY 2003 – CY 2022............................... 46
Part V: Cooperative and Condominium Abatement Program……….…… ....................... 47
Table 13: Cooperative and Condominium Abatement Program .................................................. 48
Part VI: Property Tax Delinquencies…….…… ..................................................................... 49
Table 14: Tax Delinquency Comparison, FY 2020 – FY 2022 .................................................... 51
Table 15: Citywide Real Property Tax Delinquencies by Selected Property
Types, FY 2021 – FY 2022 .......................................................................................... 52
Part VII: Historical Data ........................................................................................................... 53
Table 16: Market Values by Tax Class and Borough, FY 2004 - FY 2023 ................................. 54
Table 17: Taxable Actual and Taxable Billable Assessed Value by Tax Class, FY 2004 - FY 2023 ..... 55
Table 18: Taxable Billable Assessments by Borough, FY 2004 - FY 2023 ................................ 56
Table 19: Tax Levy Distribution by Class, FY 2004 - FY 2023 .................................................. 57
Table 20: Real Property Tax Rates, FY 2004 - FY 2023.............................................................. 58
Table 21: Real Property Tax Levy and Revenue, FY 2004 - FY 2023 ........................................ 59
Table 22: Determination of the Unused Operating Margin, FY 2004 - FY 2023 ........................ 60
Table 23: Class Share Adjustment Cap, FY 2004 - FY 2023 ....................................................... 61
Appendices ................................................................................................................................. 63
Appendix A: The Real Property Tax Class System at a Glance ................................................... 64
Appendix B: Chronology of Tax Class Changes .......................................................................... 65
Appendix C: Glossary of Common Property Terms .................................................................... 66
1
Class One is primarily one-, two-, and three-family homes; Class Two is all other residential property; Class
Three is certain types of property owned by utility companies subject to governmental supervision; and Class
Four is all other commercial property. Dollar values in this report are generally expressed in millions, rounded
to one decimal position. Sums of these rounded values may not precisely total the individual components
because they are computed using the full values.
Taxable Status Number % Change Amount % Change
Citywide 1,141,273 0.6% $446,075.1 6.8%
Fully Taxable 709,661 5.1% $227,451.0 8.6%
Partially Taxable* 385,086 -6.7% $72,912.3 1.8%
Fully Exempt 46,526 0.2% $145,711.9 6.5%
* Total billable AV for this category includes both taxable and exempt assessed value.
Amount % Change Amount % Change Amount % Change
Citywide $1,393,644.1 7.8% $283,995.8 9.2% $274,786.1 7.1%
Manhattan $473,172.8 6.7% $175,749.8 8.0% $171,242.5 6.3%
Bronx $86,344.1 10.4% $15,929.4 11.3% $15,241.6 8.3%
Brooklyn $396,242.4 9.5% $42,545.6 13.3% $40,220.5 9.2%
Queens $347,792.5 6.9% $41,822.5 10.0% $40,321.8 7.8%
Staten Island $90,092.4 8.0% $7,948.3 8.9% $7,759.7 7.6%
Class 1 $706,585.3 6.6% $23,699.0 3.9% $23,699.0 3.9%
Class 2 $347,972.3 9.1% $113,024.4 10.1% $108,322.5 7.0%
Class 3 $43,701.2 5.4% $19,508.5 5.5% $19,508.5 5.5%
Class 4 $295,385.2 9.7% $127,763.8 10.1% $123,256.1 7.9%
Table excludes fully exempt properties.
Percent
Levy of Levy % Change
Citywide $33,853.7 100.0% 7.0%
Class 1 $4,915.8 14.5% 5.6%
Class 2 $13,327.8 39.4% 7.2%
Class 3 $2,488.2 7.4% 9.5%
Class 4 $13,121.9 38.8% 6.9%
Tax Rate
(Per $100 of A. V.)
12.283
20.309
12.267
12.755
10.646
"Fast Facts" for FY 2023
($ Millions; Percent Change from FY 2022)
Total Billable
Properties
Assessed Value
Taxable Actual
Taxable Billable
Market Value
Assessed Value
Assessed Value
2
3
FY 2023 Summary
Overview
Market value rebounded in FY 2023, following FY 2022’s decline. The total citywide
market value of fully and partially taxable property approached $1.4 trillion, about 7.8
percent higher than in FY 2022. Market value increased in all boroughs, led by the Bronx
with growth of 10.4 percent, followed by Brooklyn with 9.5 percent, Staten Island 8.0
percent, Queens 6.9 percent, and Manhattan 6.7 percent. Growth was higher in Class Two
(9.1 percent) and Class Four (9.7 percent) compared to Class One (6.6 percent) and Class
Three (5.4 percent). Overall taxable billable assessed value (BAV) increased by 7.1
percent.
As the average tax rate remained at $12.283 per $100 of assessed value, the increase in the
taxable BAV created $2,217.6 million additional property tax levy for FY 2023, more than
fully recovering from FY 2022’s decline.
Residential Property
Market value of Class One properties (primarily 1-, 2-, and 3-family homes) grew by 6.6
percent, to $706.6 billion. Class One taxable BAV increased by 3.9 percent; the gap
between growth in MV and BAV predominantly reflects the impact of assessed value
growth caps.
Housing sales data indicate median one-family home prices rose by 6.0 percent in 2022.
Class Two market value increase by 9.1 percent, to $348.0 billion. Market value for large
condo developments (more than ten units) increased by 11.1 percent, while market value
for large cooperative developments increased by 9.7 percent. Since equalization increases
are phased in for these large developments, Class Two’s taxable BAV increased by only
7.0 percent in FY 2023.
Commercial Property
Class Four market value increased by 9.7 percent in FY 2023, compared to a 17.4 percent
decline in the prior year. Taxable BAV increased by 7.9 percent. Hotel market value
increased 4.7 percent, office building market value increased 8.8 percent, and overall
commercial condo market value increased by 12.4 percent.
Delinquency
The delinquency rate (percent of levy billed) decreased from 2.2 percent in FY 2021 to 1.9
percent in FY 2022, as of June 30, the last day of the fiscal year. In FY 2022, the number
of delinquent parcels declined by 2,030, to 83,226 parcels, while the delinquent amount
decreased by $107.9 million (approximately 16 percent).
4
The decline in delinquency was most pronounced in Class One and Class Four. In Class
One, the number of parcels delinquent decreased by about 6 percent, to 45,285, and the
amount delinquent decreased by eight percent, to $143.3 million. The Class Four amount
delinquent decreased by $69 million (nearly 25 percent) to $208.9 million. Hotels, stores,
and commercial condos saw the largest decrease in delinquency.
5
PART I
CURRENT YEAR PROFILES

6
REAL PROPERTY TAX
FISCAL YEAR 2023
Table 1
MARKET AND ASSESSED VALUE PROFILE
TAXABLE PROPERTIES BY PROPERTY TYPE
Citywide
Residential Market Value
Units or Actual
Property Type Parcels
Area
1
$ millions % of Total $ millions % of Total $ millions % of Total
TOTAL 1,094,747 1,393,644.1 100.00 283,995.8 100.00 274,786.1 100.00
Class 1 698,627 1,095,797 706,585.3 50.70 23,699.0 8.34 23,699.0 8.62
1-Family 312,735 312,735 281,093.3 20.17 10,564.5 3.72 10,564.5 3.84
2-Family 250,824 501,648 270,339.3 19.40 8,722.7 3.07 8,722.7 3.17
3-Family 72,228 216,684 106,730.1 7.66 2,921.3 1.03 2,921.3 1.06
Condominiums 25,030 25,030 15,046.9 1.08 473.5 0.17 473.5 0.17
Vacant Land 14,275 3,855.3 0.28 119.3 0.04 119.3 0.04
Other 23,535 39,700 29,520.4 2.12 897.7 0.32 897.7 0.33
Class 2 295,828 1,970,748 347,972.3 24.97 113,024.4 39.80 108,322.5 39.42
Rentals 23,827 1,003,988 122,127.7 8.76 46,445.8 16.35 44,167.3 16.07
Cooperatives 4,849 357,905 62,839.2 4.51 27,249.2 9.59 25,847.0 9.41
Condominiums 192,256 192,256 56,546.3 4.06 22,009.4 7.75 21,188.7 7.71
Conrentals 793 66,752 14,693.9 1.05 2,626.7 0.92 2,509.4 0.91
Condops 265 29,368 6,127.9 0.44 2,513.3 0.88 2,430.0 0.88
4-10 Family Rentals 54,428 291,420 68,896.1 4.94 9,606.8 3.38 9,606.8 3.50
2-10 Family Cooperatives 1,967 12,784 7,670.7 0.55 994.2 0.35 994.2 0.36
2-10 Family Condominiums
2
17,386 15,915 8,778.2 0.63 1,536.8 0.54 1,536.8 0.56
2-10 Family Condops 57 360 292.3 0.02 42.3 0.01 42.3 0.02
Class 3 370 43,701.2 3.14 19,508.5 6.87 19,508.5 7.10
Special Franchise 52 34,144.2 2.45 15,364.9 5.41 15,364.9 5.59
Locally Assessed 317 9,557.1 0.69 4,143.7 1.46 4,143.7 1.51
Other 1 0.0 0.00 0.0 0.00 0.0 0.00
Class 4 99,922 1,104.9 295,385.2 21.20 127,763.8 44.99 123,256.1 44.86
Office Buildings 6,837 428.7 132,797.7 9.53 59,065.7 20.80 57,729.6 21.01
Condo Office Buildings 6,190 70.2 24,353.4 1.75 10,537.1 3.71 10,276.1 3.74
Store Buildings 18,955 163.0 40,674.7 2.92 17,631.0 6.21 16,924.8 6.16
Condo Store Buildings 3,911 32.3 15,469.3 1.11 6,192.5 2.18 5,876.9 2.14
Factories 3,322 52.8 5,150.3 0.37 2,262.6 0.80 2,086.4 0.76
Warehouses 5,668 97.0 9,743.3 0.70 4,234.5 1.49 3,888.5 1.42
Condo Warehouse/Industrial 403 1.6 197.1 0.01 81.8 0.03 77.6 0.03
Self-Storage 295 26.3 3,019.3 0.22 1,190.2 0.42 1,128.8 0.41
Condo Non-Business Storage 5,510 1.0 136.7 0.01 57.4 0.02 55.9 0.02
Garages 9,702 37.0 7,476.8 0.54 3,279.3 1.15 3,048.8 1.11
Condo Parking 19,159 17.9 2,463.4 0.18 876.2 0.31 837.8 0.30
Health and Education 1,117 39.5 7,391.3 0.53 2,788.0 0.98 2,624.8 0.96
Theaters 148 6.7 1,315.4 0.09 574.9 0.20 555.6 0.20
Culture and Recreation 649 8.9 1,575.8 0.11 604.5 0.21 583.4 0.21
Condo Cultural/Medical/Education 296 3.3 827.9 0.06 305.1 0.11 300.8 0.11
Hotels 1,039 78.2 19,514.0 1.40 8,296.1 2.92 8,223.0 2.99
Condo Hotels 1,664 19.7 6,383.6 0.46 2,845.9 1.00 2,828.1 1.03
Condo Terraces/Gardens/Cabanas 506 0.1 11.6 0.00 3.2 0.00 3.1 0.00
Condos - Other Commercial 1,007 6.0 1,436.2 0.10 556.1 0.20 509.4 0.19
Utility Property 6,227 10,029.6 0.72 4,109.4 1.45 3,708.3 1.35
Vacant Land 4,175 3,158.8 0.23 1,414.8 0.50 1,152.3 0.42
Other 3,142 14.5 2,258.7 0.16 857.1 0.30 836.2 0.30
Billable
Taxable Assessed Value
1. Classes One and Two show residential unit counts. Class Four shows gross building area in millions of square feet. Area figures are not available
for Class Three and Class Four Utility property.
2. Residential unit count excludes BBLs that are classified as R8 commercial condo units in residential condo buildings.

7
REAL PROPERTY TAX
FISCAL YEAR 2023
Table 1
MARKET AND ASSESSED VALUE PROFILE
TAXABLE PROPERTIES BY PROPERTY TYPE
Manhattan
Residential Market Value
Units or Actual
Property Type Parcels
Area
1
$ millions % of Total $ millions % of Total $ millions % of Total
TOTAL 158,838 473,172.8 100.00 175,749.8 100.00 171,242.5 100.00
Class 1 6,400 11,447 41,466.8 8.76 1,261.2 0.72 1,261.2 0.74
1-Family 2,209 2,209 19,992.4 4.23 696.0 0.40 696.0 0.41
2-Family 1,828 3,656 9,578.4 2.02 258.9 0.15 258.9 0.15
3-Family 1,433 4,299 6,533.4 1.38 153.1 0.09 153.1 0.09
Condominiums 302 302 719.9 0.15 19.6 0.01 19.6 0.01
Vacant Land 0 0.0 0.00 0.0 0.00 0.0 0.00
Other 628 981 4,642.7 0.98 133.7 0.08 133.7 0.08
Class 2 130,713 763,403 210,153.6 44.41 76,659.9 43.62 74,253.8 43.36
Rentals 9,596 384,164 71,436.3 15.10 28,650.5 16.30 27,737.6 16.20
Cooperatives 2,582 158,393 45,994.7 9.72 20,182.5 11.48 19,311.5 11.28
Condominiums 105,071 105,071 43,284.2 9.15 18,196.3 10.35 17,678.7 10.32
Conrentals 247 32,997 9,147.6 1.93 1,856.8 1.06 1,823.7 1.06
Condops 190 22,367 5,464.5 1.15 2,305.9 1.31 2,234.5 1.30
4-10 Family Rentals 7,552 49,406 23,809.1 5.03 3,698.0 2.10 3,698.0 2.16
2-10 Family Cooperatives 985 6,874 5,507.4 1.16 742.2 0.42 742.2 0.43
2-10 Family Condominiums
2
4,454 3,907 5,260.9 1.11 991.3 0.56 991.3 0.58
2-10 Family Condops 36 224 248.8 0.05 36.4 0.02 36.4 0.02
Class 3 91 16,939.8 3.58 7,566.4 4.31 7,566.4 4.42
Special Franchise 14 12,409.7 2.62 5,584.4 3.18 5,584.4 3.26
Locally Assessed 77 4,530.1 0.96 1,982.0 1.13 1,982.0 1.16
Other 0 0.0 0.00 0.0 0.00 0.0 0.00
Class 4 21,634 583.4 204,612.5 43.24 90,262.3 51.36 88,161.1 51.48
Office Buildings 2,384 352.1 119,858.6 25.33 53,712.4 30.56 52,708.0 30.78
Condo Office Buildings 3,541 60.7 22,442.5 4.74 9,937.8 5.65 9,730.0 5.68
Store Buildings 2,458 29.1 13,161.9 2.78 5,805.0 3.30 5,626.4 3.29
Condo Store Buildings 2,334 19.5 12,560.1 2.65 5,307.5 3.02 5,050.0 2.95
Factories 36 1.2 190.6 0.04 85.3 0.05 81.7 0.05
Warehouses 110 3.1 444.4 0.09 194.2 0.11 189.6 0.11
Condo Warehouse/Industrial 98 0.4 55.5 0.01 24.7 0.01 24.7 0.01
Self-Storage 49 5.0 660.1 0.14 293.2 0.17 271.0 0.16
Condo Non-Business Storage 3,482 0.4 80.7 0.02 36.1 0.02 35.0 0.02
Garages 551 7.3 1,803.5 0.38 762.4 0.43 720.3 0.42
Condo Parking 935 7.6 1,405.1 0.30 543.0 0.31 524.1 0.31
Health and Education 153 8.0 2,156.0 0.46 673.1 0.38 658.9 0.38
Theaters 81 3.6 833.7 0.18 372.7 0.21 367.4 0.21
Culture and Recreation 77 1.5 300.9 0.06 97.5 0.06 95.9 0.06
Condo Cultural/Medical/Education 88 2.4 683.3 0.14 259.2 0.15 256.6 0.15
Hotels 571 58.5 15,676.8 3.31 6,798.1 3.87 6,767.6 3.95
Condo Hotels 1,637 18.3 5,997.7 1.27 2,684.3 1.53 2,670.9 1.56
Condo Terraces/Gardens/Cabanas 75 0.0 2.8 0.00 1.3 0.00 1.2 0.00
Condos - Other Commercial 149 1.8 664.4 0.14 253.9 0.14 241.0 0.14
Utility Property 2,035 3,747.7 0.79 1,634.1 0.93 1,466.2 0.86
Vacant Land 571 1,430.7 0.30 638.4 0.36 528.9 0.31
Other 219 2.8 455.6 0.10 148.1 0.08 145.9 0.09
Billable
Taxable Assessed Value
1. Classes One and Two show residential unit counts. Class Four shows gross building area in millions of square feet. Area figures are not available
for Class Three and Class Four Utility property.
2. Residential unit count excludes BBLs that are classified as R8 commercial condo units in residential condo buildings.

8
REAL PROPERTY TAX
FISCAL YEAR 2023
Table 1
MARKET AND ASSESSED VALUE PROFILE
TAXABLE PROPERTIES BY PROPERTY TYPE
Bronx
Residential Market Value
Units or Actual
Property Type Parcels
Area
1
$ millions % of Total $ millions % of Total $ millions % of Total
TOTAL 101,755 86,344.1 100.00 15,929.4 100.00 15,241.6 100.00
Class 1 68,557 119,236 48,338.3 55.98 1,891.1 11.87 1,891.1 12.41
1-Family 21,518 21,518 14,457.5 16.74 596.9 3.75 596.9 3.92
2-Family 29,524 59,048 21,515.7 24.92 858.8 5.39 858.8 5.63
3-Family 11,160 33,480 9,586.8 11.10 345.1 2.17 345.1 2.26
Condominiums 2,167 2,167 788.6 0.91 23.3 0.15 23.3 0.15
Vacant Land 2,432 601.1 0.70 19.5 0.12 19.5 0.13
Other 1,756 3,023 1,388.6 1.61 47.4 0.30 47.4 0.31
Class 2 24,021 281,953 17,911.3 20.74 5,636.0 35.38 5,316.9 34.88
Rentals 4,734 209,991 11,297.1 13.08 4,126.9 25.91 3,866.1 25.37
Cooperatives 372 29,139 1,873.7 2.17 750.1 4.71 708.4 4.65
Condominiums 14,238 14,238 839.4 0.97 168.7 1.06 155.6 1.02
Conrentals 70 3,978 360.6 0.42 55.1 0.35 51.5 0.34
Condops 8 787 56.2 0.07 7.8 0.05 7.8 0.05
4-10 Family Rentals 4,497 23,561 3,443.9 3.99 522.7 3.28 522.7 3.43
2-10 Family Cooperatives 23 187 28.4 0.03 3.0 0.02 3.0 0.02
2-10 Family Condominiums
2
79 72 11.9 0.01 1.7 0.01 1.7 0.01
2-10 Family Condops 0 0 0.0 0.00 0.0 0.00 0.0 0.00
Class 3 39 5,897.3 6.83 2,592.8 16.28 2,592.8 17.01
Special Franchise 10 5,045.4 5.84 2,270.4 14.25 2,270.4 14.90
Locally Assessed 29 851.9 0.99 322.4 2.02 322.4 2.12
Other 0 0.0 0.00 0.0 0.00 0.0 0.00
Class 4 9,138 87.7 14,197.1 16.44 5,809.6 36.47 5,440.8 35.70
Office Buildings 545 9.7 1,485.8 1.72 570.7 3.58 549.2 3.60
Condo Office Buildings 89 2.3 395.0 0.46 108.2 0.68 85.5 0.56
Store Buildings 2,569 24.2 4,871.2 5.64 2,047.5 12.85 1,980.7 13.00
Condo Store Buildings 210 2.1 465.4 0.54 159.4 1.00 151.3 0.99
Factories 437 7.3 659.7 0.76 291.1 1.83 265.9 1.74
Warehouses 710 12.7 1,144.7 1.33 493.9 3.10 458.8 3.01
Condo Warehouse/Industrial 4 0.3 42.0 0.05 18.9 0.12 18.3 0.12
Self-Storage 56 5.1 546.7 0.63 196.6 1.23 192.7 1.26
Condo Non-Business Storage 13 0.0 0.5 0.00 0.1 0.00 0.1 0.00
Garages 1,825 8.6 1,079.0 1.25 475.9 2.99 449.0 2.95
Condo Parking 355 0.9 60.2 0.07 21.6 0.14 21.0 0.14
Health and Education 172 8.5 1,473.7 1.71 632.7 3.97 545.2 3.58
Theaters 2 0.2 40.0 0.05 14.4 0.09 13.2 0.09
Culture and Recreation 111 0.8 107.2 0.12 47.4 0.30 47.2 0.31
Condo Cultural/Medical/Education 11 0.2 32.1 0.04 12.5 0.08 12.3 0.08
Hotels 76 1.9 338.9 0.39 143.0 0.90 137.0 0.90
Condo Hotels 1 0.0 3.1 0.00 1.4 0.01 1.4 0.01
Condo Terraces/Gardens/Cabanas 1 0.0 0.0 0.00 0.0 0.00 0.0 0.00
Condos - Other Commercial 41 0.1 4.9 0.01 2.2 0.01 1.7 0.01
Utility Property 801 828.6 0.96 311.2 1.95 273.1 1.79
Vacant Land 615 235.4 0.27 105.9 0.66 85.1 0.56
Other 494 2.9 382.9 0.44 155.0 0.97 152.0 1.00
Taxable Assessed Value
Billable
1. Classes One and Two show residential unit counts. Class Four shows gross building area in millions of square feet. Area figures are not available
for Class Three and Class Four Utility property.
2. Residential unit count excludes BBLs that are classified as R8 commercial condo units in residential condo buildings.

9
REAL PROPERTY TAX
FISCAL YEAR 2023
Table 1
MARKET AND ASSESSED VALUE PROFILE
TAXABLE PROPERTIES BY PROPERTY TYPE
Brooklyn
Residential Market Value
Units or Actual
Property Type Parcels
Area
1
$ millions % of Total $ millions % of Total $ millions % of Total
TOTAL 336,427 396,242.4 100.00 42,545.6 100.00 40,220.5 100.00
Class 1 214,163 382,868 274,530.3 69.28 7,177.4 16.87 7,177.4 17.85
1-Family 61,003 61,003 70,231.4 17.72 2,080.3 4.89 2,080.3 5.17
2-Family 94,391 188,782 122,903.3 31.02 3,158.7 7.42 3,158.7 7.85
3-Family 34,722 104,166 58,159.9 14.68 1,304.7 3.07 1,304.7 3.24
Condominiums 8,893 8,893 6,936.8 1.75 190.1 0.45 190.1 0.47
Vacant Land 3,103 916.4 0.23 32.9 0.08 32.9 0.08
Other 12,051 20,024 15,382.5 3.88 410.6 0.97 410.6 1.02
Class 2 88,164 534,849 79,250.5 20.00 17,665.6 41.52 16,358.7 40.67
Rentals 6,225 240,230 23,684.7 5.98 7,881.6 18.52 7,154.3 17.79
Cooperatives 915 63,674 6,185.2 1.56 2,606.7 6.13 2,312.5 5.75
Condominiums 38,532 38,532 8,195.6 2.07 2,363.7 5.56 2,136.9 5.31
Conrentals 345 19,791 3,779.4 0.95 484.1 1.14 430.4 1.07
Condops 29 1,561 225.6 0.06 38.6 0.09 33.6 0.08
4-10 Family Rentals 29,606 154,719 31,741.5 8.01 3,545.3 8.33 3,545.3 8.81
2-10 Family Cooperatives 916 5,399 2,075.8 0.52 237.5 0.56 237.5 0.59
2-10 Family Condominiums
2
11,576 10,813 3,320.6 0.84 502.3 1.18 502.3 1.25
2-10 Family Condops 20 130 42.1 0.01 5.9 0.01 5.9 0.01
Class 3 73 9,065.3 2.29 4,071.5 9.57 4,071.5 10.12
Special Franchise 11 7,287.9 1.84 3,279.5 7.71 3,279.5 8.15
Locally Assessed 62 1,777.4 0.45 792.0 1.86 792.0 1.97
Other 0 0.0 0.00 0.0 0.00 0.0 0.00
Class 4 34,027 200.2 33,396.3 8.43 13,631.2 32.04 12,612.9 31.36
Office Buildings 1,674 34.1 6,126.5 1.55 2,588.1 6.08 2,356.6 5.86
Condo Office Buildings 784 3.0 579.1 0.15 214.2 0.50 203.5 0.51
Store Buildings 6,016 44.0 8,820.6 2.23 3,697.0 8.69 3,472.1 8.63
Condo Store Buildings 609 4.9 1,176.3 0.30 329.5 0.77 305.2 0.76
Factories 1,527 21.5 2,057.5 0.52 898.3 2.11 815.5 2.03
Warehouses 2,374 38.3 3,709.0 0.94 1,608.4 3.78 1,437.2 3.57
Condo Warehouse/Industrial 290 0.4 34.9 0.01 15.5 0.04 14.0 0.03
Self-Storage 95 7.7 925.1 0.23 350.7 0.82 330.1 0.82
Condo Non-Business Storage 1,328 0.2 19.8 0.01 6.0 0.01 5.6 0.01
Garages 3,450 9.7 1,951.8 0.49 862.6 2.03 789.3 1.96
Condo Parking 10,162 3.7 440.7 0.11 116.9 0.27 112.0 0.28
Health and Education 440 12.6 1,986.8 0.50 715.6 1.68 694.0 1.73
Theaters 48 1.7 273.5 0.07 118.3 0.28 112.1 0.28
Culture and Recreation 201 1.9 276.1 0.07 104.0 0.24 102.4 0.25
Condo Cultural/Medical/Education 115 0.4 56.9 0.01 16.5 0.04 16.1 0.04
Hotels 170 6.8 1,487.6 0.38 556.7 1.31 536.5 1.33
Condo Hotels 11 0.7 173.4 0.04 71.9 0.17 70.0 0.17
Condo Terraces/Gardens/Cabanas 300 0.0 6.1 0.00 1.2 0.00 1.2 0.00
Condos - Other Commercial 288 2.6 473.8 0.12 173.0 0.41 161.2 0.40
Utility Property 1,478 1,477.0 0.37 636.3 1.50 578.4 1.44
Vacant Land 1,235 458.9 0.12 205.6 0.48 160.9 0.40
Other 1,432 6.0 885.1 0.22 344.9 0.81 339.0 0.84
Billable
Taxable Assessed Value
1. Classes One and Two show residential unit counts. Class Four shows gross building area in millions of square feet. Area figures are not available
for Class Three and Class Four Utility property.
2. Residential unit count excludes BBLs that are classified as R8 commercial condo units in residential condo buildings.

10
REAL PROPERTY TAX
FISCAL YEAR 2023
Table 1
MARKET AND ASSESSED VALUE PROFILE
TAXABLE PROPERTIES BY PROPERTY TYPE
Queens
Residential Market Value
Units or Actual
Property Type Parcels
Area
1
$ millions % of Total $ millions % of Total $ millions % of Total
TOTAL 366,981 347,792.5 100.00 41,822.5 100.00 40,321.8 100.00
Class 1 288,515 432,520 262,864.6 75.58 9,877.8 23.62 9,877.8 24.50
1-Family 151,249 151,249 126,214.5 36.29 4,964.0 11.87 4,964.0 12.31
2-Family 94,483 188,966 92,692.1 26.65 3,384.8 8.09 3,384.8 8.39
3-Family 24,018 72,054 31,800.4 9.14 1,092.3 2.61 1,092.3 2.71
Condominiums 6,094 6,094 3,619.2 1.04 125.6 0.30 125.6 0.31
Vacant Land 4,895 1,181.0 0.34 35.2 0.08 35.2 0.09
Other 7,776 14,157 7,357.4 2.12 276.0 0.66 276.0 0.68
Class 2 49,008 372,693 39,252.5 11.29 12,621.4 30.18 11,977.4 29.70
Rentals 3,094 160,924 15,153.8 4.36 5,579.7 13.34 5,216.4 12.94
Cooperatives 954 104,856 8,664.8 2.49 3,661.6 8.76 3,471.7 8.61
Condominiums 31,574 31,574 4,029.4 1.16 1,197.8 2.86 1,140.7 2.83
Conrentals 126 9,414 1,358.7 0.39 229.6 0.55 202.7 0.50
Condops 38 4,653 381.6 0.11 161.0 0.38 154.0 0.38
4-10 Family Rentals 11,927 59,885 9,429.6 2.71 1,740.4 4.16 1,740.4 4.32
2-10 Family Cooperatives 36 274 52.1 0.01 10.6 0.03 10.6 0.03
2-10 Family Condominiums
2
1,258 1,107 181.1 0.05 40.7 0.10 40.7 0.10
2-10 Family Condops 1 6 1.4 0.00 0.0 0.00 0.0 0.00
Class 3 99 9,100.5 2.62 4,071.7 9.74 4,071.7 10.10
Special Franchise 11 7,625.0 2.19 3,431.3 8.20 3,431.3 8.51
Locally Assessed 88 1,475.5 0.42 640.4 1.53 640.4 1.59
Other 0 0.0 0.00 0.0 0.00 0.0 0.00
Class 4 29,359 197.2 36,574.8 10.52 15,251.7 36.47 14,394.9 35.70
Office Buildings 1,537 27.6 4,564.5 1.31 1,890.9 4.52 1,824.8 4.53
Condo Office Buildings 1,710 4.1 920.1 0.26 269.6 0.64 250.5 0.62
Store Buildings 6,308 51.2 11,337.7 3.26 4,993.8 11.94 4,793.4 11.89
Condo Store Buildings 737 5.8 1,254.5 0.36 393.7 0.94 368.3 0.91
Factories 1,249 21.8 2,120.8 0.61 934.0 2.23 872.6 2.16
Warehouses 2,050 35.7 3,843.7 1.11 1,677.8 4.01 1,555.6 3.86
Condo Warehouse/Industrial 11 0.6 64.8 0.02 22.8 0.05 20.7 0.05
Self-Storage 74 6.3 728.8 0.21 282.4 0.68 271.8 0.67
Condo Non-Business Storage 687 0.4 35.7 0.01 15.3 0.04 15.2 0.04
Garages 3,160 9.5 2,182.6 0.63 972.7 2.33 897.4 2.23
Condo Parking 7,528 5.6 549.6 0.16 193.6 0.46 179.6 0.45
Health and Education 257 8.3 1,485.4 0.43 637.1 1.52 601.4 1.49
Theaters 13 0.7 108.5 0.03 44.6 0.11 41.0 0.10
Culture and Recreation 174 4.3 740.5 0.21 326.5 0.78 310.3 0.77
Condo Cultural/Medical/Education 82 0.3 55.6 0.02 16.9 0.04 15.8 0.04
Hotels 206 10.4 1,926.7 0.55 781.6 1.87 766.8 1.90
Condo Hotels 15 0.7 209.5 0.06 88.3 0.21 85.7 0.21
Condo Terraces/Gardens/Cabanas 130 0.0 2.8 0.00 0.7 0.00 0.7 0.00
Condos - Other Commercial 231 1.5 288.0 0.08 124.7 0.30 103.3 0.26
Utility Property 1,500 3,026.2 0.87 1,107.9 2.65 1,019.4 2.53
Vacant Land 1,040 674.8 0.19 303.4 0.73 234.8 0.58
Other 660 2.4 454.2 0.13 173.3 0.41 165.9 0.41
Taxable Assessed Value
Billable
1. Classes One and Two show residential unit counts. Class Four shows gross building area in millions of square feet. Area figures are not available
for Class Three and Class Four Utility property.
2. Residential unit count excludes BBLs that are classified as R8 commercial condo units in residential condo buildings.

11
REAL PROPERTY TAX
FISCAL YEAR 2023
Table 1
MARKET AND ASSESSED VALUE PROFILE
TAXABLE PROPERTIES BY PROPERTY TYPE
Staten Island
Residential Market Value
Units or Actual
Property Type Parcels
Area
1
$ millions % of Total $ millions % of Total $ millions % of Total
TOTAL 130,746 90,092.4 100.00 7,948.3 100.00 7,759.7 100.00
Class 1 120,992 149,726 79,385.3 88.12 3,491.6 43.93 3,491.6 45.00
1-Family 76,756 76,756 50,197.6 55.72 2,227.4 28.02 2,227.4 28.70
2-Family 30,598 61,196 23,649.8 26.25 1,061.6 13.36 1,061.6 13.68
3-Family 895 2,685 649.5 0.72 26.0 0.33 26.0 0.34
Condominiums 7,574 7,574 2,982.4 3.31 114.9 1.45 114.9 1.48
Vacant Land 3,845 1,156.8 1.28 31.7 0.40 31.7 0.41
Other 1,324 1,515 749.1 0.83 30.0 0.38 30.0 0.39
Class 2 3,922 17,850 1,404.4 1.56 441.5 5.56 415.8 5.36
Rentals 178 8,679 555.7 0.62 207.1 2.61 192.9 2.49
Cooperatives 26 1,843 120.7 0.13 48.3 0.61 42.9 0.55
Condominiums 2,841 2,841 197.7 0.22 82.9 1.04 76.8 0.99
Conrentals 5 572 47.6 0.05 1.2 0.02 1.2 0.02
Condops 0 0 0.0 0.00 0.0 0.00 0.0 0.00
4-10 Family Rentals 846 3,849 472.1 0.52 100.4 1.26 100.4 1.29
2-10 Family Cooperatives 7 50 6.9 0.01 0.9 0.01 0.9 0.01
2-10 Family Condominiums
2
19 16 3.7 0.00 0.8 0.01 0.8 0.01
2-10 Family Condops 0 0 0.0 0.00 0.0 0.00 0.0 0.00
Class 3 68 2,698.3 3.00 1,206.1 15.17 1,206.1 15.54
Special Franchise 6 1,776.2 1.97 799.3 10.06 799.3 10.30
Locally Assessed 61 922.1 1.02 406.8 5.12 406.8 5.24
Other 1 0.0 0.00 0.0 0.00 0.0 0.00
Class 4 5,764 36.4 6,604.5 7.33 2,809.1 35.34 2,646.2 34.10
Office Buildings 697 5.3 762.4 0.85 303.6 3.82 290.9 3.75
Condo Office Buildings 66 0.1 16.7 0.02 7.3 0.09 6.6 0.09
Store Buildings 1,604 14.4 2,483.3 2.76 1,087.7 13.68 1,052.1 13.56
Condo Store Buildings 21 0.1 13.0 0.01 2.3 0.03 2.2 0.03
Factories 73 1.1 121.7 0.14 53.9 0.68 50.8 0.65
Warehouses 424 7.1 601.5 0.67 260.2 3.27 247.3 3.19
Condo Warehouse/Industrial 0 0.0 0.0 0.00 0.0 0.00 0.0 0.00
Self-Storage 21 2.2 158.5 0.18 67.4 0.85 63.2 0.81
Condo Non-Business Storage 0 0.0 0.0 0.00 0.0 0.00 0.0 0.00
Garages 716 2.0 459.9 0.51 205.7 2.59 192.9 2.49
Condo Parking 179 0.1 7.8 0.01 1.1 0.01 1.0 0.01
Health and Education 95 2.0 289.4 0.32 129.5 1.63 125.2 1.61
Theaters 4 0.6 59.8 0.07 25.0 0.31 21.8 0.28
Culture and Recreation 86 0.4 151.2 0.17 29.1 0.37 27.7 0.36
Condo Cultural/Medical/Education 0 0.0 0.0 0.00 0.0 0.00 0.0 0.00
Hotels 16 0.6 83.9 0.09 16.7 0.21 15.0 0.19
Condo Hotels 0 0.0 0.0 0.00 0.0 0.00 0.0 0.00
Condo Terraces/Gardens/Cabanas 0 0.0 0.0 0.00 0.0 0.00 0.0 0.00
Condos - Other Commercial 298 0.0 5.2 0.01 2.3 0.03 2.2 0.03
Utility Property 413 950.2 1.05 420.0 5.28 371.1 4.78
Vacant Land 714 359.1 0.40 161.6 2.03 142.6 1.84
Other 337 0.4 81.0 0.09 35.8 0.45 33.5 0.43
Taxable Assessed Value
Billable
1. Classes One and Two show residential unit counts. Class Four shows gross building area in millions of square feet. Area figures are not available
for Class Three and Class Four Utility property.
2. Residential unit count excludes BBLs that are classified as R8 commercial condo units in residential condo buildings.

12
REAL PROPERTY TAX
FISCAL YEAR 2023
Table 2
TAX DOLLAR VALUE OF REAL PROPERTY TAX EXEMPTIONS
BY PROPERTY TYPE
Citywide
Property Type Parcels $ millions Parcels $ millions Parcels $ millions
TOTAL 46,526 15,868.3 385,086 3,075.7 431,612 18,944.0
Class 1
7,646 95.3 281,681 318.4 289,327 413.7
1-Family
978 15.9 147,807 146.9 148,785 162.8
2-Family
567 4.8 97,088 107.8 97,655 112.6
3-Family
337 2.7 24,465 43.8 24,802 46.6
Condominiums
47 0.1 10,271 16.8 10,318 16.9
Vacant Land
5,503 69.8 10 0.0 5,513 69.8
Other
214 1.9 2,040 3.1 2,254 5.0
Class 2 11,133 2,493.6 87,800 2,178.4
98,933
4,672.0
Rentals
3,446 1,670.9 3,403 1,000.8 6,849 2,671.7
Cooperatives
253 421.6 4,503 119.2 4,756 540.8
Condominiums
5,733 118.5 64,968 399.6 70,701 518.1
Conrentals
271 228.0 476 476.1 747 704.1
Condops
13 10.9 236 28.9 249 39.8
4-10 Fam Rentals
1,281 39.9 6,331 108.3 7,612 148.2
2-10 Fam Co-ops
47 1.7 1,244 5.2 1,291 7.0
2-10 Fam Condos
88 2.1 6,601 40.0 6,689 42.0
2-10 Fam Condops
1 0.1 38 0.3 39 0.3
Class 3 109 121.4 15 20.0
124
141.4
Class 4 27,638 13,158.0 15,590 558.9
43,228
13,716.9
Office Buildings
407 1,027.4 508 75.1 915 1,102.5
Store Buildings
132 81.2 1,053 72.9 1,185 154.0
Utility Property
6,362 2,093.0 27 43.4 6,389 2,136.5
Hotels
70 63.2 117 56.2 187 119.4
Factories
132 26.8 219 5.9 351 32.7
Commercial Condos
1,381 639.7 12,486 175.9 13,867 815.7
Garages
1,285 107.5 189 8.5 1,474 116.0
Warehouses & Self-Storage
192 58.4 515 34.1 707 92.6
Vacant Land
3,718 543.1 9 0.6 3,727 543.7
Health & Educational
3,033 3,554.2 132 56.9 3,165 3,611.1
Theaters
50 25.2 18 1.8 68 27.0
Cultural & Recreation
2,943 2,096.1 45 11.0 2,988 2,107.1
Other
7,933 2,842.0 272 16.6 8,205 2,858.6
Fully Exempt
Partially Exempt
Total Exempt

13
REAL PROPERTY TAX
FISCAL YEAR 2023
Table 2
TAX DOLLAR VALUE OF REAL PROPERTY TAX EXEMPTIONS
BY PROPERTY TYPE
Manhattan
Property Type Parcels $ millions Parcels $ millions Parcels $ millions
TOTAL 12,393 6,815.8 21,766 1,151.6 34,159 7,967.5
Class 1
97 10.8 1,228 2.0 1,325 12.8
1-Family 59 9.1 206 0.4 265 9.4
2-Family 18 0.9 412 0.6 430 1.5
3-Family 10 0.3 496 0.8 506 1.2
Condominiums 0 0.0 66 0.1 66 0.1
Vacant Land 0 0.0 0 0.0 0 0.0
Other 10 0.5 48 0.1 58 0.6
Class 2 6,990 1,219.7 19,702 950.0
26,692
2,169.7
Rentals 1,108 760.8 1,102 420.0 2,210 1,180.7
Cooperatives 92 236.8 2,349 60.7 2,441 297.5
Condominiums 5,328 113.3 14,199 152.6 19,527 265.9
Conrentals 56 80.5 140 279.1 196 359.6
Condops 5 8.8 169 18.5 174 27.3
4-10 Fam Rentals 350 17.2 602 13.2 952 30.4
2-10 Fam Co-ops 17 0.9 572 3.1 589 4.1
2-10 Fam Condos 33 1.3 550 2.8 583 4.2
2-10 Fam Condops 1 0.1 19 0.0 20 0.1
Class 3 10
0.4
7 7.2
17
7.6
Class 4 5,296 5,584.8 829 192.4
6,125
5,777.3
Office Buildings 163 933.0 53 24.1 216 957.2
Store Buildings 33 34.1 53 12.9 86 46.9
Utility Property 799 843.1 3 5.6 802 848.7
Hotels 59 58.7 33 26.9 92 85.6
Factories 1 0.0 2 0.1 3 0.1
Commercial Condos 1,053 553.0 556 74.9 1,609 627.9
Garages 126 31.6 17 4.7 143 36.4
Warehouses & Self-Storage 10 2.7 3 1.0 13 3.7
Vacant Land 453 92.1 7 0.5 460 92.6
Health & Educational 715 1,392.0 27 31.6 742 1,423.6
Theaters 37 17.3 1 0.3 38 17.6
Cultural & Recreation 578 981.5 19 3.9 597 985.4
Other 1,269 645.8 55 6.0 1,324 651.7
Fully Exempt
Partially Exempt
Total Exempt

14
REAL PROPERTY TAX
FISCAL YEAR 2023
Table 2
TAX DOLLAR VALUE OF REAL PROPERTY TAX EXEMPTIONS
BY PROPERTY TYPE
Bronx
Property Type Parcels $ millions Parcels $ millions Parcels $ millions
TOTAL 6,620 1,829.0 41,794 274.0 48,414 2,103.0
Class 1 1,024 5.3 25,614 26.2
26,638
31.4
1-Family 103 0.9 9,677 8.0 9,780 8.9
2-Family 94 0.6 11,087 9.7 11,181 10.3
3-Family 94 0.7 3,607 5.9 3,701 6.5
Condominiums 5 0.0 1,079 2.0 1,084 2.0
Vacant Land 704 3.0 3 0.0 707 3.1
Other 24 0.1 161 0.5 185 0.6
Class 2 1,773 454.5 15,464 177.4
17,237
631.8
Rentals 1,240 308.4 1,082 112.8 2,322 421.2
Cooperatives 87 68.3 343 10.6 430 78.9
Condominiums 134 0.4 13,236 25.6 13,370 26.0
Conrentals
128 70.6 46 13.3 174 83.8
Condops 4 1.1 8 2.1 12 3.2
4-10 Fam Rentals 170 5.4 686 12.6 856 17.9
2-10 Fam Co-ops 10 0.3 14 0.2 24 0.5
2-10 Fam Condos 0 0.0 49 0.3 49 0.3
2-10 Fam Condops 0 0.0 0 0.0 0 0.0
Class 3 5 12.1 1 7.8
6
19.9
Class 4 3,818 1,357.2 715 62.7
4,533
1,419.9
Office Buildings 49 9.3 80 10.5 129 19.8
Store Buildings 22 21.7 185 15.7 207 37.3
Utility Property 960 190.8 2 6.4 962 197.2
Hotels 2 0.3 6 1.1 8 1.4
Factories 20 9.2 26 0.6 46 9.8
Commercial Condos 66 6.7 231 14.3 297 21.0
Garages 256 27.0 51 1.0 307 28.0
Warehouses & Self-Storage 43 23.6 72 7.7 115 31.3
Vacant Land 324 13.3 0 . 324 13.3
Health & Educational 513 578.2 26 3.2 539 581.3
Theaters 2 0.4 1 0.4 3 0.7
Cultural & Recreation 511 239.2 3 0.1 514 239.3
Other 1,050 237.6 32 1.8 1,082 239.4
Fully Exempt
Partially Exempt
Total Exempt

15
REAL PROPERTY TAX
FISCAL YEAR 2023
Table 2
TAX DOLLAR VALUE OF REAL PROPERTY TAX EXEMPTIONS
BY PROPERTY TYPE
Brooklyn
Property Type Parcels $ millions Parcels $ millions Parcels $ millions
TOTAL 11,467 2,705.4 123,436 967.1 134,903 3,672.6
Class 1 1,773 42.6 82,244 95.8
84,017
138.3
1-Family
124 1.1 27,752 26.9 27,876 28.0
2-Family 245 1.7 37,945 41.2 38,190 42.9
3-Family 188 1.3 11,780 18.3 11,968 19.6
Condominiums 26 0.1 3,690 8.3 3,716 8.4
Vacant Land 1,077 37.4 3 0.0 1,080 37.4
Other 113 0.9 1,074 1.1 1,187 2.1
Class 2 1,893 540.9 33,137 717.6
35,030
1,258.4
Rentals 919 408.4 916 317.0 1,835 725.4
Cooperatives 54 58.7 848 19.0 902 77.8
Condominiums 67 2.7 21,710 147.8 21,777 150.4
Conrentals 65 52.7 210 136.3 275 189.0
Condops 4 1.0 26 7.1 30 8.0
4-10 Fam Rentals 720 16.3 3,484 55.0 4,204 71.3
2-10 Fam Co-ops 20 0.5 620 1.6 640 2.1
2-10 Fam Condos 44 0.7 5,305 33.6 5,349 34.2
2-10 Fam Condops 0 . 18 0.2 18 0.2
Class 3 13 9.2 1 1.0
14
10.2
Class 4 7,788 2,112.8 8,054 152.8
15,842
2,265.6
Office Buildings 82 48.8 210 18.5 292 67.3
Store Buildings 42 13.6 409 29.3 451 42.9
Utility Property 1,885 362.7 7 3.0 1,892 365.7
Hotels 6 2.4 34 15.2 40 17.6
Factories 47 3.3 103 2.9 150 6.3
Commercial Condos 138 69.3 6,810 41.9 6,948 111.2
Garages 506 20.6 62 1.6 568 22.3
Warehouses & Self-Storage 72 15.2 212 13.3 284 28.5
Vacant Land 734 178.6 1 0.1 735 178.7
Health & Educational 1,017 721.7 55 18.7 1,072 740.4
Theaters 8 4.9 10 0.5 18 5.4
Cultural & Recreation 824 293.8 7 2.2 831 295.9
Other 2,427 377.8 134 5.6 2,561 383.4
Fully Exempt
Partially Exempt
Total Exempt

16
REAL PROPERTY TAX
FISCAL YEAR 2023
Table 2
TAX DOLLAR VALUE OF REAL PROPERTY TAX EXEMPTIONS
BY PROPERTY TYPE
Queens
Property Type Parcels $ millions Parcels $ millions Parcels $ millions
TOTAL 9,257 3,846.3 143,702 605.1 152,959 4,451.4
Class 1 2,470 27.4 119,319 145.0
121,789
172.4
1-Family 512 3.8 72,780 78.3 73,292 82.1
2-Family 165 1.2 35,211 42.8 35,376 44.0
3-Family 43 0.4 8,397 18.7 8,440 19.1
Condominiums 6 0.0 2,305 3.9 2,311 4.0
Vacant Land 1,683 21.6 3 0.0 1,686 21.6
Other
61 0.4 623 1.3 684 1.7
Class 2 399 250.8 18,701 323.7
19,100
574.5
Rentals
133 166.2 288 145.8 421 312.0
Cooperatives
20 57.8 939 28.2 959 86.0
Condominiums
192 2.1 15,133 72.9 15,325 75.0
Conrentals
21 23.9 76 44.9 97 68.8
Condops
0 0.0 33 1.3 33 1.3
4-10 Fam Rentals
28 0.8 1,514 27.2 1,542 28.0
2-10 Fam Co-ops
0 0.0 33 0.1 33 0.1
2-10 Fam Condos
5 0.1 684 3.2 689 3.3
2-10 Fam Condops 0 0.0 1 0.1 1 0.1
Class 3
80 96.8 2 3.0 82 99.8
Class 4 6,308 3,471.3 5,680 133.5
11,988
3,604.7
Office Buildings 79 25.5 123 17.7 202 43.2
Store Buildings 29 5.8 312 11.8 341 17.6
Utility Property 1,969 589.8 12 27.6 1,981 617.4
Hotels 2 1.3 39 10.9 41 12.1
Factories
61 13.8 85 2.1 146 15.9
Commercial Condos 113 9.6 4,809 44.1 4,922 53.7
Garages 338 25.6 49 1.0 387 26.6
Warehouses & Self-Storage 62 16.6 166 10.6 228 27.2
Vacant Land 585 167.9 1 0.0 586 167.9
Health & Educational 587 662.0 20 3.3 607 665.3
Theaters 2 2.6 5 0.4 7 3.0
Cultural & Recreation 722 471.0 12 0.7 734 471.7
Other 1,759 1,479.9 47 3.2 1,806 1,483.1
Fully Exempt
Partially Exempt
Total Exempt

17
REAL PROPERTY TAX
FISCAL YEAR 2023
Table 2
TAX DOLLAR VALUE OF REAL PROPERTY TAX EXEMPTIONS
BY PROPERTY TYPE
Staten Island
Property Type Parcels $ millions Parcels $ millions Parcels $ millions
TOTAL 6,789 671.6 54,388 77.9 61,177 749.6
Class 1 2,282 9.2 53,276 49.5
55,558
58.7
1-Family
180 1.0 37,392 33.4 37,572 34.4
2-Family 45 0.3 12,433 13.5 12,478 13.8
3-Family 2 0.0 185 0.2 187 0.2
Condominiums 10 0.0 3,131 2.4 3,141 2.4
Vacant Land
2,039 7.8 1 0.0 2,040 7.8
Other 6 0.0 134 0.1 140 0.2
Class 2 78 27.7 796 9.8
874
37.6
Rentals 46 27.2 15 5.3 61 32.4
Cooperatives 0 0.0 24 0.7 24 0.7
Condominiums 12 0.0 690 0.7 702 0.7
Conrentals 1 0.3 4 2.5 5 2.8
Condops 0 0.0 0 0.0 0 0.0
4-10 Fam Rentals 13 0.2 45 0.4 58 0.6
2-10 Fam Co-ops 0 0.0 5 0.2 5 0.2
2-10 Fam Condos 6 0.0 13 0.1 19 0.1
2-10 Fam Condops 0 0.0 0 0.0 0 0.0
Class 3
1 2.8 4 1.0 5 3.9
Class 4 4,428 631.9 312 17.5
4,740
649.4
Office Buildings
34 10.9 42 4.2 76 15.1
Store Buildings 6 6.1 94 3.2 100 9.3
Utility Property 749 106.6 3 0.8 752 107.4
Hotels 1 0.5 5 2.2 6 2.7
Factories 3 0.5 3 0.1 6 0.6
Commercial Condos 11 1.1 80 0.7 91 1.8
Garages 59 2.7 10 0.1 69 2.8
Warehouses & Self-Storage 5 0.3 62 1.6 67 1.9
Vacant Land 1,622 91.2 0 . 1,622 91.2
Health & Educational 201 200.3 4 0.1 205 200.4
Theaters 1 0.0 1 0.2 2 0.2
Cultural & Recreation 308 110.6 4 4.2 312 114.8
Other 1,428 101.0 4 0.1 1,432 101.0
Fully Exempt
Partially Exempt
Total Exempt
18
REAL PROPERTY TAX
FISCAL YEAR 2023
Table 3
TAX DOLLAR VALUE OF REAL PROPERTY TAX EXEMPTIONS
BY EXEMPTION TYPE
Citywide
Amount
Number % of Total ($ millions)
% of Total
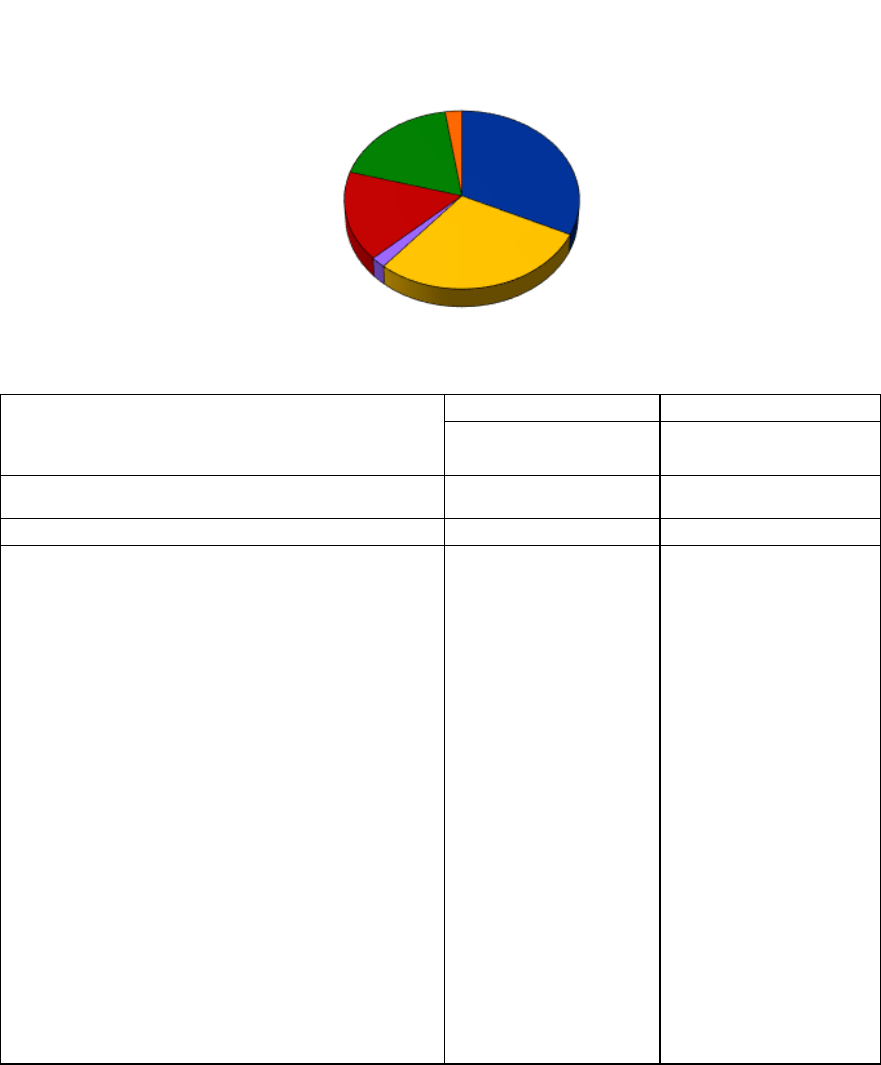
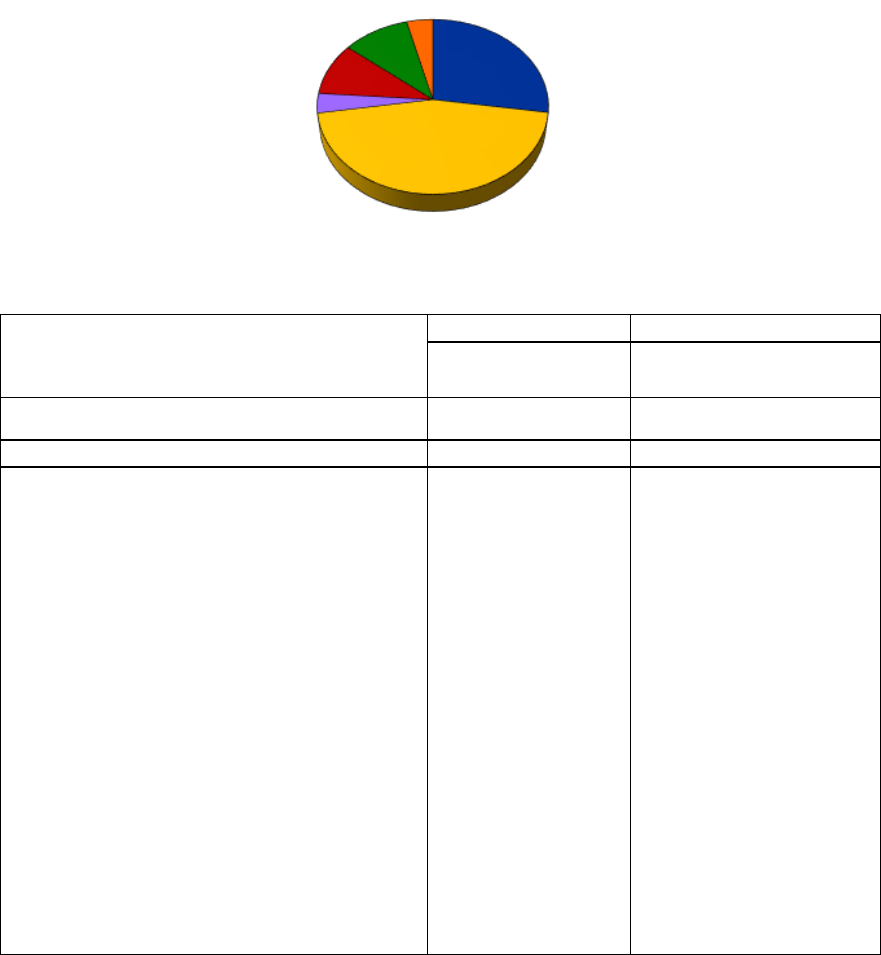
CITYWIDE TOTAL 604,266 100.00 18,944.0 100.00
PUBLIC PROPERTY 28,788 4.76 11,577.4 61.11
Government 17,609 2.91 6,071.1 32.05
New York City 15,488 2.56 5,058.9 26.70
New York State 1,397 0.23 228.2 1.20
U.S. Government 263 0.04 654.5 3.45
Foreign Governments 461 0.08 129.5 0.68
Public Authorities 11,179 1.85 5,506.2 29.07
Battery Park City Authority 3,826 0.63 310.5 1.64
Economic Development Corporation 222 0.04 370.9 1.96
Industrial Development Agency 334 0.06 578.4 3.05
Metropolitan Transportation Authority 3,795 0.63 872.0 4.60
Nat'l Passenger Rail Corp.- AMTRAK 440 0.07 62.3 0.33
NYC Educational Construction Fund 130 0.02 79.3 0.42
NYC Housing Authority 1,154 0.19 731.7 3.86
NYS Dormitory Authority 151 0.02 350.5 1.85
NYS Urban Development Corporation 847 0.14 580.9 3.07
Port Authority of NY & NJ 250 0.04 1,429.6 7.55
New York Power Authority 30 0.00 140.0 0.74
Exemption Type
Exemptions
Tax Dollar Value
Government
32.0%
Public
Authorities
29.1%
Individual
Assistance
1.9%
Institutional
16.3%
Residential
18.3%
Commercial/
Industrial
2.4%
Tax Dollar Value of Exemptions

19
REAL PROPERTY TAX
FISCAL YEAR 2023
Table 3
TAX DOLLAR VALUE OF REAL PROPERTY TAX EXEMPTIONS
BY EXEMPTION TYPE
Citywide
Amount
Number % of Total ($ millions)
% of Total
PRIVATE PROPERTY 575,478 95.24 7,366.7 38.89
Institutional 13,886 2.30 3,084.0 16.28
Cemeteries 208 0.03 86.1 0.45
Charitable 2,593 0.43 301.7 1.59
Cultural Institutions 362 0.06 155.6 0.82
Educational Facilities 1,234 0.20 788.1 4.16
Medical Care 1,109 0.18 835.4 4.41
Religious 7,913 1.31 854.2 4.51
Special Interest 467 0.08 63.0 0.33
Residential 91,333 15.11 3,460.1 18.27
Fallout Shelters 1 0.00 0.0 0.00
Housing Development Fund Companies 236 0.04 76.6 0.40
HPD Div. of Alternative Management(DAMP) 1,046 0.17 50.6 0.27
J-51 Exemption 20,071 3.32 214.3 1.13
Limited-Dividend Housing Companies 21 0.00 12.4 0.07
Ltd-Profit Housing Companies/Mitchell-Lama 274 0.05 398.2 2.10
New Multiple Dwellings - 421A 60,470 10.01 1,806.3 9.53
Redevelopment Companies 244 0.04 129.2 0.68
Residential Conv. Lower Manhattan 25 0.00 0.1 0.00
Solar, Wind or Farm Waste Energy System 1 0.00 0.0 0.00
Special Incentive Programs 1,928 0.32 332.5 1.76
State-Assisted Private Housing 32 0.01 11.9 0.06
Urban Development Action Area Projects 4,541 0.75 15.3 0.08
420-c Low-Income Housing 2,443 0.40 412.7 2.18
Commercial/Industrial 4,101 0.68 453.6 2.39
Environmental Protection Exemption 1 0.00 0.0 0.00
Industrial & Commercial Incentive Program 3,968 0.66 399.0 2.11
Industrial Waste Facility 11 0.00 0.7 0.00
Jamaica Water Supply 120 0.02 11.5 0.06
Madison Square Garden 1 0.00 42.4 0.22
Individual Assistance 466,158 77.14 368.9 1.95
Physically Disabled Crime Victims 6 0.00 0.0 0.00
Low-Income Disabled Homeowner 3,370 0.56 10.5 0.06
School Tax Relief 372,584 61.66 134.4 0.71
Senior Citizen Homeowner 55,609 9.20 185.6 0.98
Veterans Exemption 33,903 5.61 38.2 0.20
Clergy Exemption 686 0.11 0.2 0.00
Exemption Type
Exemptions
Tax Dollar Value

20
REAL PROPERTY TAX
FISCAL YEAR 2023
Table 3
TAX DOLLAR VALUE OF REAL PROPERTY TAX EXEMPTIONS
BY EXEMPTION TYPE
Manhattan
Amount
Number
% of Total
($ millions)
% of Total
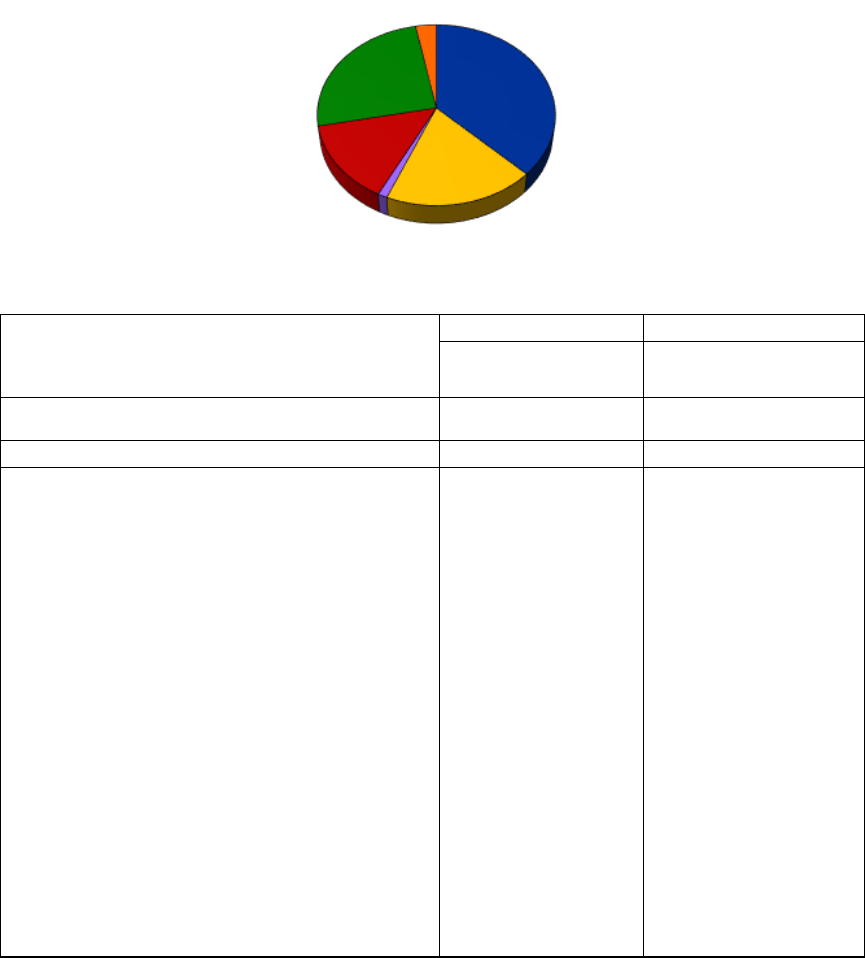
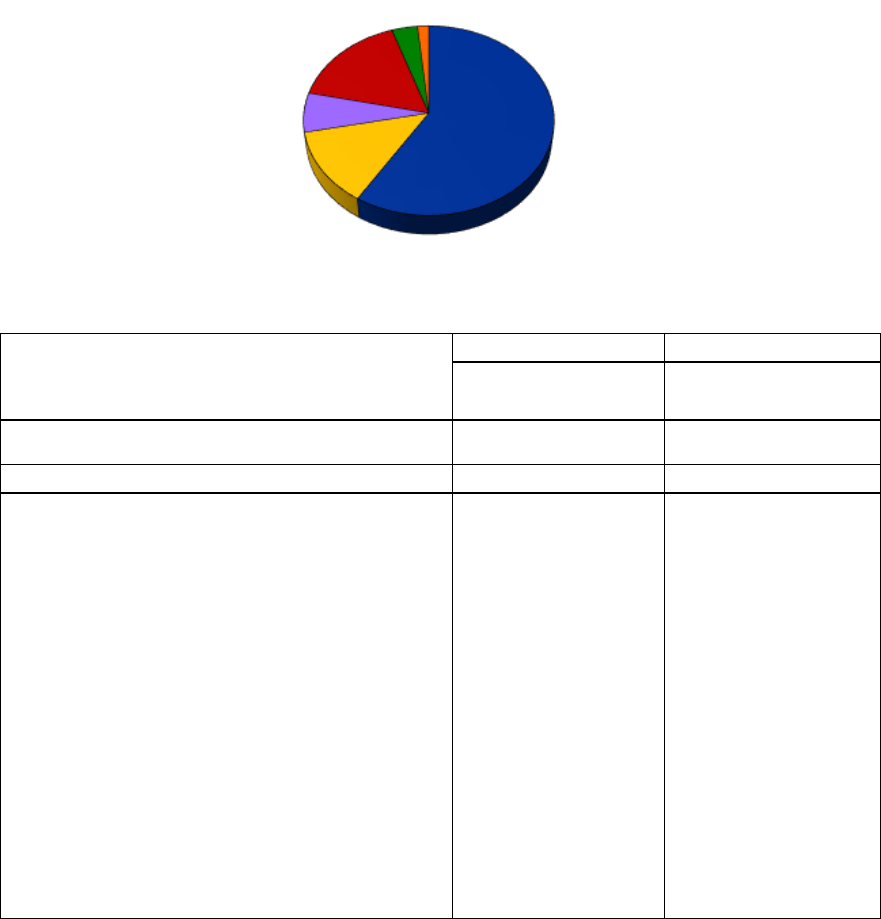
BOROUGH TOTAL 68,721 100.00 7,967.5 100.00
PUBLIC PROPERTY 7,830 11.39 4,707.6 59.08
Government 2,172 3.16 2,325.0 29.18
New York City 1,592 2.32 1,901.1 23.86
New York State 94 0.14 95.4 1.20
U.S. Government 59 0.09 200.6 2.52
Foreign Governments 427 0.62 127.9 1.60
Public Authorities 5,658 8.23 2,382.5 29.90
Battery Park City Authority 3,826 5.57 310.5 3.90
Economic Development Corporation 87 0.13 272.6 3.42
Industrial Development Agency 89 0.13 275.2 3.45
Metropolitan Transportation Authority 351 0.51 397.2 4.99
Nat'l Passenger Rail Corp.- AMTRAK 184 0.27 43.1 0.54
NYC Educational Construction Fund 115 0.17 71.1 0.89
NYC Housing Authority 236 0.34 333.8 4.19
NYS Dormitory Authority 36 0.05 161.8 2.03
NYS Urban Development Corporation 634 0.92 404.3 5.07
Port Authority of NY & NJ 97 0.14 109.9 1.38
New York Power Authority 3 0.00 3.0 0.04
Tax Dollar Value
Exemptions
Exemption Type
Government
29.2%
Public Authorities
29.9%
Individual Assistance
0.5%
Institutional
21.7%
Residential
17.6%
Commercial/Industrial
1.1%
Tax Dollar Value of Exemptions

21
REAL PROPERTY TAX
FISCAL YEAR 2023
Table 3
TAX DOLLAR VALUE OF REAL PROPERTY TAX EXEMPTIONS
BY EXEMPTION TYPE
Manhattan
Amount
Number
% of Total
($ millions)
% of Total
PRIVATE PROPERTY 60,891 88.61 3,259.9 40.92
Institutional 3,819 5.56 1,730.4 21.72
Cemeteries 7 0.01 1.2 0.01
Charitable 803 1.17 177.3 2.23
Cultural Institutions 335 0.49 153.9 1.93
Educational Facilities 846 1.23 558.3 7.01
Medical Care 593 0.86 526.6 6.61
Religious 1,118 1.63 280.4 3.52
Special Interest 117 0.17 32.7 0.41
Residential 11,889 17.30 1,400.4 17.58
Housing Development Fund Companies 62 0.09 23.8 0.30
HPD Div. of Alternative Management(DAMP) 580 0.84 37.3 0.47
J-51 Exemption 1,948 2.83 79.2 0.99
Limited-Dividend Housing Companies 2 0.00 4.1 0.05
Ltd-Profit Housing Companies/Mitchell-Lama 61 0.09 152.0 1.91
New Multiple Dwellings - 421A 7,627 11.10 759.7 9.54
Redevelopment Companies 51 0.07 68.1 0.85
Residential Conv. Lower Manhattan 25 0.04 0.1 0.00
Special Incentive Programs 595 0.87 152.0 1.91
State-Assisted Private Housing 10 0.01 4.5 0.06
Urban Development Action Area Projects 274 0.40 1.4 0.02
420-c Low-Income Housing 654 0.95 118.2 1.48
Commercial/Industrial 169 0.25 90.8 1.14
Industrial & Commercial Incentive Program 164 0.24 48.4 0.61
Industrial Waste Facility 4 0.01 0.0 0.00
Madison Square Garden 1 0.00 42.4 0.53
Individual Assistance 45,014 65.50 38.3 0.48
Physically Disabled Crime Victims 1 0.00 0.0 0.00
Low-Income Disabled Homeowner 157 0.23 0.7 0.01
School Tax Relief 38,977 56.72 13.0 0.16
Senior Citizen Homeowner 2,727 3.97 15.4 0.19
Veterans Exemption 3,144 4.58 9.1 0.11
Clergy 8 0.01 0.0 0.00
Exemption Type
Exemptions
Tax Dollar Value
22
REAL PROPERTY TAX
FISCAL YEAR 2023
Table 3
TAX DOLLAR VALUE OF REAL PROPERTY TAX EXEMPTIONS
BY EXEMPTION TYPE
Bronx
Amount
Number
% of Total
($ millions)
% of Total
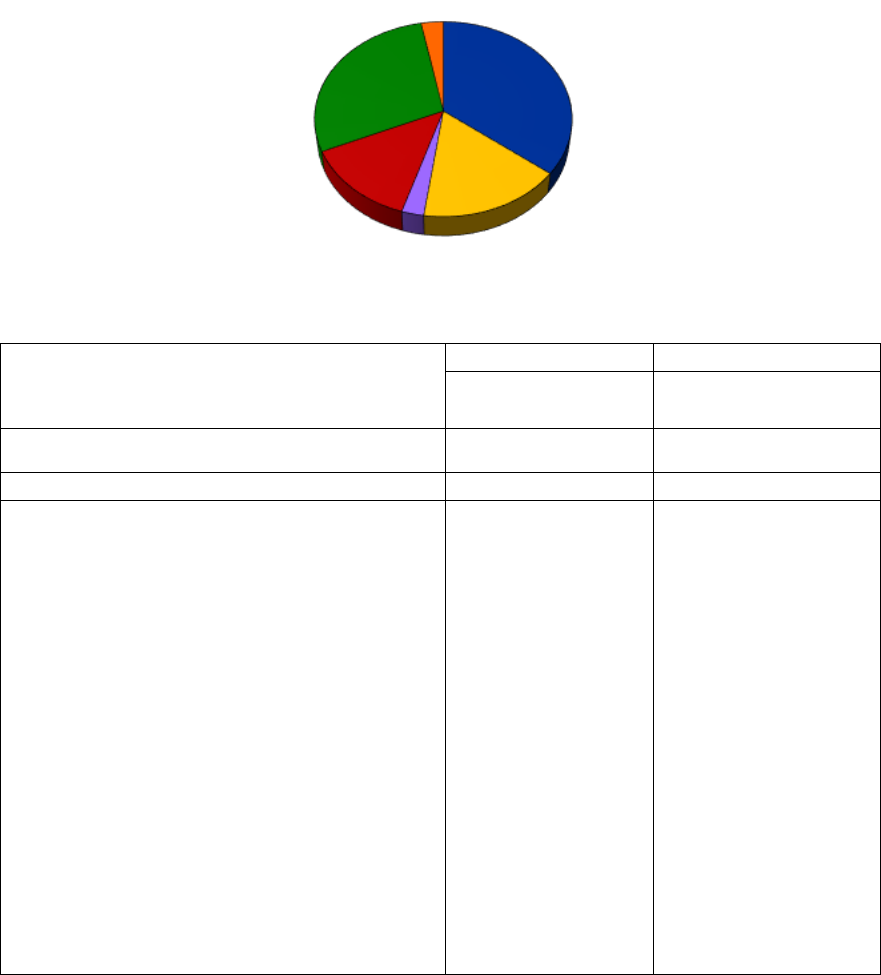
BOROUGH TOTAL 63,266 100.00 2,103.0 100.00
PUBLIC PROPERTY 3,176 5.02 1,184.4 56.32
Government 2,268 3.58 783.1 37.24
New York City 2,120 3.35 713.6 33.93
New York State 114 0.18 35.9 1.71
U.S. Government 27 0.04 32.4 1.54
Foreign Governments 7 0.01 1.2 0.06
Public Authorities 908 1.44 401.3 19.08
Economic Development Corporation 15 0.02 15.5 0.74
Industrial Development Agency 47 0.07 137.2 6.52
Metropolitan Transportation Authority 413 0.65 68.4 3.25
Nat'l Passenger Rail Corp.- AMTRAK 133 0.21 3.3 0.16
NYC Educational Construction Fund 8 0.01 4.3 0.21
NYC Housing Authority 254 0.40 123.3 5.86
NYS Dormitory Authority 31 0.05 35.7 1.70
NYS Urban Development Corporation 2 0.00 1.3 0.06
Port Authority of NY & NJ 1 0.00 0.2 0.01
New York Power Authority 4 0.01 12.1 0.57
Tax Dollar Value
Exemption Type
Exemptions
Government
37.2%
Public Authorities
19.1%
Individual Assistance
1.2%
Institutional
14.3%
Residential
25.2%
Commercial/
Industrial
3.0%
Tax Dollar Value of Exemptions

23
REAL PROPERTY TAX
FISCAL YEAR 2023
Table 3
TAX DOLLAR VALUE OF REAL PROPERTY TAX EXEMPTIONS
BY EXEMPTION TYPE
Bronx
Amount
Number
% of Total
($ millions)
% of Total
PRIVATE PROPERTY 60,090 94.98 918.7 43.68
Institutional 1,799 2.84 300.8 14.30
Cemeteries 21 0.03 6.0 0.28
Charitable 395 0.62 37.8 1.80
Cultural Institutions 4 0.01 0.3 0.01
Educational Facilities 140 0.22 86.2 4.10
Medical Care 128 0.20 79.3 3.77
Religious 1,061 1.68 85.1 4.05
Special Interest 50 0.08 6.1 0.29
Residential 18,283 28.90 529.0 25.16
Housing Development Fund Companies 59 0.09 17.0 0.81
HPD Div. of Alternative Management(DAMP) 225 0.36 5.6 0.27
J-51 Exemption 13,201 20.87 71.1 3.38
Limited-Dividend Housing Companies 14 0.02 3.6 0.17
Ltd-Profit Housing Companies/Mitchell-Lama 83 0.13 93.2 4.43
New Multiple Dwellings - 421A 2,542 4.02 86.1 4.09
Redevelopment Companies 102 0.16 19.3 0.92
Special Incentive Programs 756 1.19 93.0 4.42
State-Assisted Private Housing 11 0.02 1.6 0.08
Urban Development Action Area Projects 603 0.95 0.8 0.04
420-c Low-Income Housing 687 1.09 137.8 6.55
Commercial/Industrial 495 0.78 63.6 3.03
Industrial & Commercial Incentive Program 495 0.78 63.6 3.03
Individual Assistance 39,513 62.46 25.2 1.20
Low-Income Disabled Homeowner 314 0.50 0.8 0.04
School Tax Relief 32,436 51.27 11.5 0.55
Senior Citizen Homeowner 4,053 6.41 10.4 0.50
Veterans Exemption 2,678 4.23 2.4 0.12
Clergy Exemption 32 0.05 0.0 0.00
Exemptions
Tax Dollar Value
Exemption Type
24
REAL PROPERTY TAX
FISCAL YEAR 2023
Table 3
TAX DOLLAR VALUE OF REAL PROPERTY TAX EXEMPTIONS
BY EXEMPTION TYPE
Brooklyn
Amount
Number
% of Total
($ millions)
% of Total
BOROUGH TOTAL 172,378 100.00 3,672.6 100.00
PUBLIC PROPERTY 5,900 3.42 1,918.8 52.25
Government 3,736 2.17 1,303.8 35.50
New York City 3,544 2.06 1,019.2 27.75
New York State 123 0.07 36.9 1.00
U.S. Government 65 0.04 247.6 6.74
Foreign Governments 4 0.00 0.0 0.00
Public Authorities 2,164 1.26 615.0 16.75
Economic Development Corporation 39 0.02 71.5 1.95
Industrial Development Agency 84 0.05 14.1 0.38
Metropolitan Transportation Authority 1,466 0.85 154.7 4.21
NYC Educational Construction Fund 5 0.00 1.9 0.05
NYC Housing Authority 473 0.27 204.9 5.58
NYS Dormitory Authority 35 0.02 40.3 1.10
NYS Urban Development Corporation 12 0.01 108.9 2.97
Port Authority of NY & NJ 47 0.03 9.6 0.26
New York Power Authority 3 0.00 9.1 0.25
Exemption Type
Exemptions
Tax Dollar Value
Government
35.5%
Public Authorities
16.7%
Individual
Assistance
2.6%
Institutional
13.5%
Residential
28.6%
Commercial/
Industrial
3.0%
Tax Dollar Value of Exemptions

25
REAL PROPERTY TAX
FISCAL YEAR 2023
Table 3
TAX DOLLAR VALUE OF REAL PROPERTY TAX EXEMPTIONS
BY EXEMPTION TYPE
Brooklyn
Amount
Number
% of Total
($ millions)
% of Total
PRIVATE PROPERTY 166,478 96.58 1,753.8 47.75
Institutional 4,299 2.49 $496.8 13.53
Cemeteries 38 0.02 27.3 0.74
Charitable 662 0.38 46.7 1.27
Cultural Institutions 8 0.00 0.4 0.01
Educational Facilities 131 0.08 76.3 2.08
Medical Care 170 0.10 98.9 2.69
Religious 3,195 1.85 239.1 6.51
Special Interest 95 0.06 8.0 0.22
Residential 40,557 23.53 $1,051.8 28.64
Housing Development Fund Companies 89 0.05 25.3 0.69
HPD Div. of Alternative Management(DAMP) 235 0.14 7.6 0.21
J-51 Exemption 4,528 2.63 49.4 1.34
Limited-Dividend Housing Companies 5 0.00 4.7 0.13
Ltd-Profit Housing Companies/Mitchell-Lama 95 0.06 99.5 2.71
New Multiple Dwellings - 421A 31,803 18.45 669.2 18.22
Redevelopment Companies 76 0.04 24.2 0.66
Special Incentive Programs 487 0.28 38.9 1.06
State-Assisted Private Housing 6 0.00 2.9 0.08
Urban Development Action Area Projects 2,200 1.28 5.7 0.15
420-c Low-Income Housing 1,033 0.60 124.4 3.39
Commercial/Industrial 1,637 0.95 $110.5 3.01
Environmental Protection Exemption 1 0.00 0.0 0.00
Industrial & Commercial Incentive Program 1,635 0.95 110.5 3.01
Industrial Waste Facility 1 0.00 0.0 0.00
Individual Assistance 119,985 69.61 $94.7 2.58
Physically Disabled Crime Victims 2 0.00 0.0 0.00
Low-Income Disabled Homeowner 827 0.48 2.6 0.07
School Tax Relief 96,712 56.10 35.0 0.95
Senior Citizen Homeowner 15,247 8.85 50.4 1.37
Veterans Exemption 6,859 3.98 6.6 0.18
Clergy Exemption 338 0.20 0.1 0.00
Exemptions
Tax Dollar Value
Exemption Type
26
REAL PROPERTY TAX
FISCAL YEAR 2023
Table 3
TAX DOLLAR VALUE OF REAL PROPERTY TAX EXEMPTIONS
BY EXEMPTION TYPE
Queens
Amount
Number
% of Total
($ millions)
% of Total
BOROUGH TOTAL 224,522 100.00 4,451.4 100.00
PUBLIC PROPERTY 6,006 2.68 3,228.8 72.53
Government 4,081 1.82 1,217.6 27.35
New York City 3,752 1.67 1,024.5 23.02
New York State 210 0.09 29.5 0.66
U.S. Government 96 0.04 163.2 3.67
Foreign Governments 23 0.01 0.4 0.01
Public Authorities 1,925 0.86 2,011.2 45.18
Economic Development Corporation 6 0.00 5.6 0.13
Industrial Development Agency 102 0.05 150.9 3.39
Metropolitan Transportation Authority 1,218 0.54 226.5 5.09
Nat'l Passenger Rail Corp.- AMTRAK 123 0.05 15.9 0.36
NYC Educational Construction Fund 2 0.00 1.9 0.04
NYC Housing Authority 176 0.08 58.3 1.31
NYS Dormitory Authority 42 0.02 80.4 1.81
NYS Urban Development Corporation 199 0.09 66.4 1.49
Port Authority of NY & NJ 41 0.02 1,292.4 29.03
New York Power Authority 16 0.01 112.9 2.54
Exemption Type
Exemptions
Tax Dollar Value
Government
27.4%
Public Authorities
45.2%
Individual Assistance
3.6%
Institutional
9.7%
Residential
10.2%
Commercial/
Industrial
4.0%
Tax Dollar Value of Exemptions

27
REAL PROPERTY TAX
FISCAL YEAR 2023
Table 3
TAX DOLLAR VALUE OF REAL PROPERTY TAX EXEMPTIONS
BY EXEMPTION TYPE
Queens
Amount
Number
% of Total
($ millions)
% of Total
PRIVATE PROPERTY 218,516 97.32 1,222.7 27.47
Institutional 3,092 1.38 433.4 9.74
Cemeteries 91 0.04 37.0 0.83
Charitable 510 0.23 28.9 0.65
Cultural Institutions 13 0.01 0.9 0.02
Educational Facilities 75 0.03 52.5 1.18
Medical Care 179 0.08 103.4 2.32
Religious 2,110 0.94 200.0 4.49
Special Interest 114 0.05 10.6 0.24
Residential 20,260 9.02 452.0 10.15
Fallout Shelters 1 0.00 0.0 0.00
Housing Development Fund Companies 18 0.01 7.8 0.17
HPD Div. of Alternative Management(DAMP) 6 0.00 0.0 0.00
J-51 Exemption 388 0.17 11.0 0.25
Ltd-Profit Housing Companies/Mitchell-Lama 30 0.01 50.1 1.13
New Multiple Dwellings - 421A 18,212 8.11 285.5 6.41
Redevelopment Companies 14 0.01 17.2 0.39
Solar, Wind or Farm Waste Energy System 1 0.00 0.0 0.00
Special Incentive Programs 69 0.03 44.0 0.99
State-Assisted Private Housing 5 0.00 2.9 0.06
Urban Development Action Area Projects 1,461 0.65 7.4 0.17
420-c Low-Income Housing 55 0.02 26.1 0.59
Commercial/Industrial 1,537 0.68 176.8 3.97
Industrial & Commercial Incentive Program 1,412 0.63 164.7 3.70
Industrial Waste Facility 5 0.00 0.6 0.01
Jamaica Water Supply 120 0.05 11.5 0.26
Individual Assistance 193,627 86.24 160.5 3.60
Physically Disabled Crime Victims 1 0.00 0.0 0.00
Low-Income Disabled Homeowner 1,311 0.58 4.1 0.09
School Tax Relief 152,501 67.92 56.1 1.26
Senior Citizen Homeowner 26,003 11.58 87.4 1.96
Veterans Exemption 13,555 6.04 12.8 0.29
Clergy Exemption 256 0.11 0.1 0.00
Exemption Type
Exemptions
Tax Dollar Value
28
REAL PROPERTY TAX
FISCAL YEAR 2023
Table 3
TAX DOLLAR VALUE OF REAL PROPERTY TAX EXEMPTIONS
BY EXEMPTION TYPE
Staten Island
Amount
Number
% of Total
($ millions)
% of Total
BOROUGH TOTAL 75,379 100.00 749.6 100.00
PUBLIC PROPERTY 5,876 7.80 537.9 71.76
Government 5,352 7.10 441.7 58.92
New York City 4,480 5.94 400.5 53.43
New York State 856 1.14 30.5 4.07
U.S. Government 16 0.02 10.6 1.42
Public Authorities 524 0.70 96.2 12.83
Economic Development Corporation 75 0.10 5.7 0.76
Industrial Development Agency 12 0.02 1.0 0.14
Metropolitan Transportation Authority 347 0.46 25.2 3.37
NYC Housing Authority 15 0.02 11.4 1.52
NYS Dormitory Authority 7 0.01 32.2 4.30
NYS Urban Development Corporation 0 0.00 0.0 0.00
Port Authority of NY & NJ 64 0.08 17.6 2.35
New York Power Authority 4 0.01 3.0 0.40
Exemption Type
Exemptions
Tax Dollar Value
Government
58.9%
Public Authorities
12.8%
Individual
Assistance
6.7%
Institutional
16.4%
Residential
3.6%
Commercial/
Industrial
1.6%
Tax Dollar Value of Exemptions

29
REAL PROPERTY TAX
FISCAL YEAR 2023
Table 3
TAX DOLLAR VALUE OF REAL PROPERTY TAX EXEMPTIONS
BY EXEMPTION TYPE
Staten Island
Amount
Number
% of Total
($ millions)
% of Total
PRIVATE PROPERTY 69,503 92.20 211.7 28.24
Institutional 877 1.16 122.7 16.37
Cemeteries 51 0.07 14.5 1.94
Charitable 223 0.30 11.1 1.48
Cultural Institutions 2 0.00 0.0 0.00
Educational Facilities 42 0.06 14.8 1.97
Medical Care 39 0.05 27.1 3.61
Religious 429 0.57 49.6 6.62
Special Interest 91 0.12 5.7 0.75
Residential 344 0.46 26.9 3.59
Housing Development Fund Companies 8 0.01 2.8 0.37
J-51 Exemption 6 0.01 3.7 0.50
Ltd-Profit Housing Companies/Mitchell-Lama 5 0.01 3.4 0.45
New Multiple Dwellings - 421A 286 0.38 5.8 0.77
Redevelopment Companies 1 0.00 0.3 0.05
Special Incentive Programs 21 0.03 4.7 0.63
Urban Development Action Area Projects 3 0.00 0.0 0.00
420-c Low-Income Housing 14 0.02 6.2 0.83
Commercial/Industrial 263 0.35 11.8 1.57
Environmental Protection Exemption 0 0.00 0.0 0.00
Industrial & Commercial Incentive Program 262 0.35 11.8 1.57
Industrial Waste Facility 1 0.00 0.0 0.00
Individual Assistance 68,019 90.24 50.3 6.71
Physically Disabled Crime Victims 2 0.00 0.0 0.00
Low-Income Disabled Homeowner 761 1.01 2.2 0.30
School Tax Relief 51,958 68.93 18.8 2.51
Senior Citizen Homeowner 7,579 10.05 22.0 2.93
Veterans Exemption 7,667 10.17 7.2 0.96
Clergy Exemption 52 0.07 0.0 0.00
Exemption Type
Exemptions
Tax Dollar Value
30
31
PART II
TAX LEVY
32
Tax Levy
Property Tax Revenue and the Tax Levy
When the City’s budget is adopted, budgeted expenditures and the forecasted revenue from
all non-property tax sources are determined. The difference between these amounts is the
property tax revenue needed to balance the budget. Because of the property tax’s unique
role in balancing the budget, it is the only tax over which the City has the discretion to
determine the rate without prior legislation from the State.
In order to ensure that the property tax revenue needed to balance the budget will be
achieved, allowances must be made for such items as uncollectible taxes, abatements,
current-year collection of taxes levied in prior years, and refunds. As a group, these items
are referred to as the property tax reserve.
The tax levy is equal to the property tax revenue plus the property tax reserve. It is the total
amount of tax charged (or levied) based on assessed values.
Class Shares
There are four classes of property in New York City. Class One is primarily 1-, 2-, and 3-
family homes. Class Two is other residential property. Class Three is utility real property
owned by regulated utility companies, excluding land and buildings. Class Four is all other
commercial property, including utility company land and buildings. Each class is
responsible for a specific share of the property tax levy, called the class share or class levy.
The class shares are determined each year according to a formula in State law. The
percentages of the levy represented by the class shares that were in place in 1989 are the base
proportions. These base proportions are adjusted according to changes in market value, as
determined by the State Office of Real Property Tax Services (ORPTS). The resulting
proportions are called the current base proportions. The current base proportions are adjusted
to reflect physical and other non-equalization (non-market) changes that are reflected on the
current assessment roll. The results are the adjusted base proportions, which are multiplied
by the total levy to determine the levy for each class of property. (State law establishes an
annual cap on the amount by which any class’s share of the levy can be increased.)
Assessment Roll
The assessment roll includes the assessed value of all taxable real property in the City. All
taxable property is subject to a tax determined by applying the applicable tax rate to taxable
assessed value. For the purposes of determining the property tax levy and rates, exempt
value attributable to the School Tax Relief (STAR) program is not deducted from the
assessment roll. The value of the STAR exemption is addressed as one of the components
of the property tax reserve.

33
Property Tax Reserve
The property tax reserve accounts for items that affect property tax revenue but are
independent of the tax levy. Reserve components include provisions for uncollectible taxes,
abatements, refunds and current-year collection of taxes levied in prior years.
Many of the reserve components are adjustments to revenue and do not affect tax bills.
However, some components, such as abatements and the STAR allowance, are reflected in
the actual tax bills that are sent to property owners. These items are summarized in the
following table:
REAL PROPERTY TAX
FISCAL YEAR 2023
Table 4
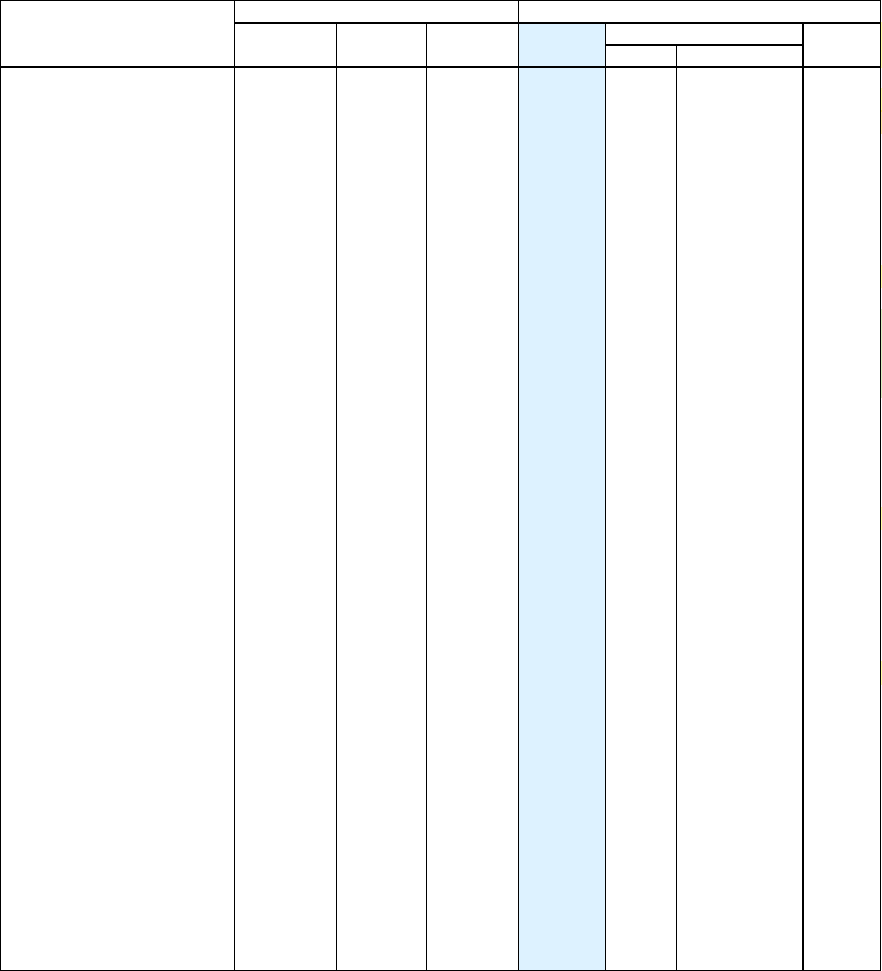
RECONCILIATION OF THE ASSESSMENT ROLL, TAX LEVY AND NET LEVY BILLED
Amount
Column Action ($ millions) Comment
Assessment Roll 274,786.1 Total of all taxable billable assessed value
STAR add 828.5 Value of STAR exemption
Levy Roll 275,614.6 Assessment roll used for tax fixing
Tax Levy 33,853.7 Total property tax levy equals levy roll times
overall average tax rate
Billing Adjustments
Tax Levy 33,853.7
STAR subtract 134.4 Tax value of STAR exemption added back earlier
Abatements subtract 1,387.6 Tax abatements that reduce liability
Net Levy Billed 32,331.6 Amount of levy that is billed to property owners
34
REAL PROPERTY TAX
FISCAL YEAR 2023
Table 4
RECONCILIATION OF THE ASSESSMENT ROLL, TAX LEVY AND NET LEVY BILLED
BY PROPERTY TYPE
($ MILLIONS)
Assessment STAR Levy Tax
Net Levy
Property Type
Roll Addback Roll Levy
STAR
2
Abatements
3
Billed
Class 1
23,699.0 506.3 24,205.3 4,915.8 -96.5 -26.7 4,792.6
1-Family 10,564.5 270.8
10,835.4 2,200.5 -51.6 -13.7 2,135.2
2-Family 8,722.7 176.6
8,899.3 1,807.3 -33.6 -11.0 1,762.7
3-Family 2,921.3 40.8
2,962.1 601.6 -7.8 -1.7 592.1
Condominiums 473.5 12.1
485.5 98.6 -2.3 -0.1 96.2
Vacant Land 119.3 0.0
119.3 24.2 0.0 0.0 24.2
Other 897.7 6.0
903.7 183.5 -1.1 -0.3 182.1
Class 2
108,322.5 322.2 108,644.6 13,327.8 -37.9 -896.1 12,393.8
Rentals 44,167.3 0.1
44,167.4 5,418.2 0.0 -171.8 5,246.3
Cooperatives 25,847.0 250.3
26,097.4 3,201.4 -29.5 -471.5 2,700.5
Condominiums 21,188.7 42.1
21,230.9 2,604.5 -5.0 -177.6 2,421.9
Conrentals 2,509.4 0.0
2,509.4 307.8 0.0 -2.0 305.9
Condops 2,430.0 12.2
2,442.1 299.6 -1.4 -37.0 261.1
4-10 Fam Rentals 9,606.8 9.9
9,616.7 1,179.7 -1.1 -12.7 1,165.9
2-10 Fam Co-ops 994.2 5.6
999.8 122.6 -0.7 -13.5 108.4
2-10 Fam Condos 1,536.8 1.8
1,538.6 188.7 -0.2 -9.4 179.1
2-10 Fam Condops 42.3 0.2
42.5 5.2 0.0 -0.6 4.6
Class 3
19,508.5
0.0
19,508.5 2,488.2
0.0 0.0
2,488.2
Special Franchise 15,364.9 0.0 15,364.9
1,959.7 0.0 0.0 1,959.7
Locally Assessed 4,143.7 0.0 4,143.7
528.5 0.0 0.0 528.5
Other 0.0 0.0 0.0
0.0 0.0 0.0 0.0
Class 4
123,256.1 0.1 123,256.1 13,121.9 0.0 -464.8 12,657.1
Office Buildings 57,729.6 0.0
57,729.6 6,145.9 0.0 -151.0 5,994.9
Store Buildings 16,924.8 0.0
16,924.8 1,801.8 0.0 -62.5 1,739.3
Utility Property 3,708.3 0.0
3,708.3 394.8 0.0 0.0 394.8
Hotels 8,223.0 0.0
8,223.0 875.4 0.0 -54.1 821.4
Factories 2,086.4 0.0
2,086.4 222.1 0.0 -10.0 212.1
Commercial Condos 20,765.6 0.0
20,765.6 2,210.7 0.0 -96.1 2,114.7
Garages 3,048.8 0.0
3,048.8 324.6 0.0 -7.7 316.9
Warehouses & Self-Storage 5,017.3 0.0
5,017.3 534.1 0.0 -61.4 472.8
Vacant Land 1,152.3 0.0
1,152.3 122.7 0.0 -0.3 122.4
Health and Education 2,624.8 0.0
2,624.8 279.4 0.0 -12.9 266.6
Theaters 555.6 0.0
555.6 59.1 0.0 -5.2 54.0
Culture and Recreation 583.4 0.0
583.4 62.1 0.0 -1.0 61.1
Other 836.2 0.0
836.2 89.0 0.0 -2.8 86.2
TOTAL
274,786.1 828.5 275,614.6 33,853.7 -134.4 -1,387.6 32,331.6
1. Billing Adjustments do not account for the revenue reduction attributable to the $150 property tax Homeowner Rebate Program.
2. Does not include Battery Park City and Mitchell-Lama. These parcels are fully exempt and receive STAR benefits as a credit
against their PILOT (Battery Park City) and Shelter Rent (Mitchell-Lama).
3. Includes Brooklyn Bridge Park Development Corp Abatement (BBPDC). These parcels are fully taxable; abatement applied
to the entire tax bill is equal to the PILOT payment. The PILOT is paid directly to the BBPDC.
Billing Adjustments
1
Taxable Billable Assessed Value
Tax Amounts
35
Brooklyn
Bridge Park
Development
Green Solar SCRIE/ Corporation
Property Type ICAP Coop/Condo J51 Roof Panel DRIE (BBPDC)
3
Total
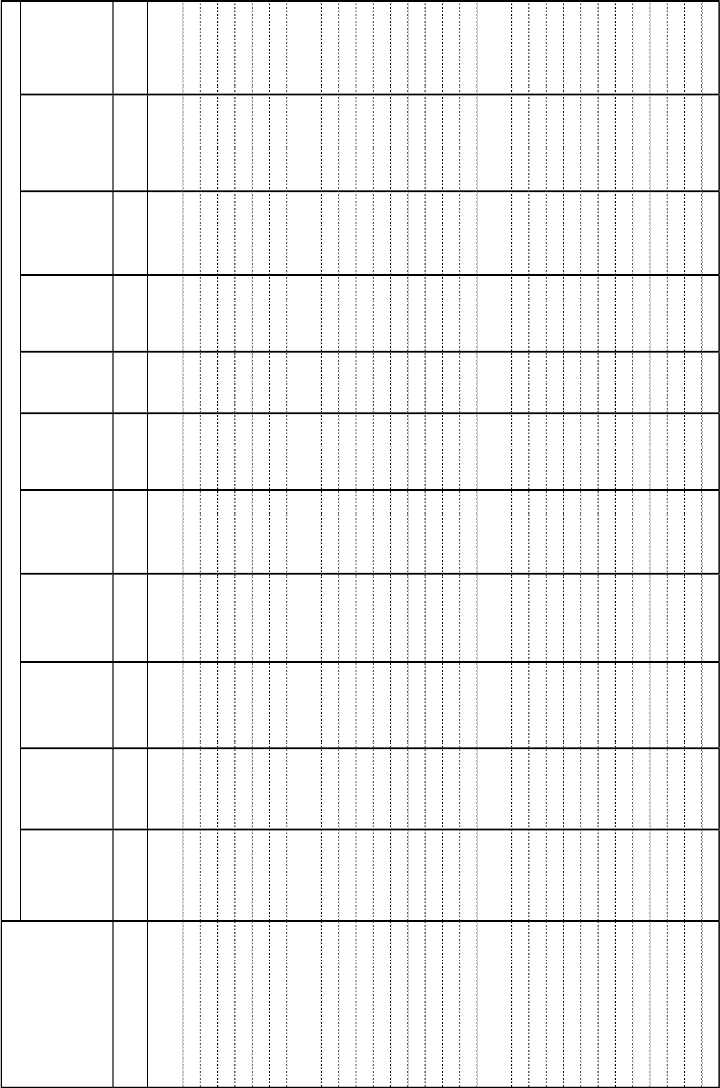
TOTAL $14,416,504 $5,139,762 $18,361,138 $442,561,966 $656,083,504 $52,008,181 $0 $30,523,198 $146,951,856 $21,560,961 $1,387,607,071
Class 1 338,147 26,392,077 26,730,224
1-Family 13,668,548 13,668,548
2-Family 56,717 10,903,535 10,960,253
3-Family 160,018 1,570,558 1,730,576
Condominiums 92,108 10,276 102,384
Vacant Land 3,582 3,582
Other 29,303 235,577 264,880
Class 2 4,913,353 18,349,935 656,008,504 51,645,323 2,561,795 146,951,856 15,670,472 896,101,238
Rentals 1,999,814 17,622,862 28,166,154 1,621,422 122,400,171 16,990 171,827,413
Cooperatives 491,959 446,558,623 12,388,570 601,563 11,467,687 471,508,402
Condominiums 1,896,554 151,762,352 5,363,608 6,640 2,938,614 15,653,482 177,621,250
Conrentals 956,285 22,220 294,026 690,934 1,963,465
Condops 35,400,732 410,421 1,175,769 36,986,923
4-10 Fam Rentals 235,113 4,037,427 296,568 8,093,472 12,662,580
2-10 Fam Co-ops 13,339,633 55,406 13,641 133,690 13,542,372
2-10 Fam Condos 60,700 8,322,741 929,711 21,961 51,519 9,386,632
2-10 Fam Condops 602,203 602,203
Class 4 14,416,504 226,409 11,203 442,561,966 75,000 24,711 1,569,326 5,890,489 464,775,609
Office Buildings 3,352,528 145,798,166 105,811 1,733,704 150,990,209
Store Buildings 90,000 11,203 62,110,230 18,662 246,355 62,476,450
Hotels 53,618,520 3,953 431,163 54,053,636
Factories 3,758,147 5,998,177 225,696 9,982,020
Commercial Condos
1,508,045 226,409 93,736,984 75,000 2,096 6,062 501,692 96,056,287
Garages 104,606 7,460,380 82,355 21,846 7,669,187
Warehouses & Self-Storage 5,603,178 54,949,175 837,652 61,390,005
Vacant Land 254,559 254,559
Health and Education 12,866,304
12,866,304
Theaters 5,164,930 5,164,930
Culture and Recreation 859,101 65,395 119,672
1,044,168
Other
2,827,854
2,827,854
1. Homeowner Rebate Program is not reported in this table. For more information on this program, see p. 41 of New York City Department of Finance, Annual Report On Tax Expenditures, FY23.
2. In previous versions of this report, these columns were titled Commercial Revitalization/Expansion Programs , subset for lease and residential conversion. There is no change to what is reported within these columns.
3. Parcels are fully taxable; abatement applied to the entire tax bill is equal to the PILOT payment. The PILOT is paid directly to the BBPDC.
REAL PROPERTY TAX
FISCAL YEAR 2023
Table 5
ABATEMENTS
1
BY PROPERTY TYPE AND ABATEMENT TYPE
Abatement Type
Major Capital
Improvement
Section
421g Lower
Manhattan
Conversion
Programs
2
Commercial
Revitalization
& Expansion
Programs
2
36
37
PART III
OFFICE BUILDINGS

38
REAL PROPERTY TAX
FISCAL YEAR 2023
Table 6
OFFICE BUILDING PROFILE
BY BOROUGH
($ MILLIONS)
Citywide Manhattan Bronx Brooklyn Queens Staten Is.
All Parcels
Number of Parcels 7,244 2,547 594 1,756 1,616 731
Sq. Ft. (000) 498,436.0 410,798.0 10,883.4 39,192.3 30,773.6 6,788.7
Market Value $153,236.8 $138,352.0 $1,672.6 $7,147.6 $5,082.1 $982.5
Billable AV $57,729.6 $52,708.0 $549.2 $2,356.6 $1,824.8 $290.9
Exempt AV $10,356.0 $8,990.8 $186.3 $631.8 $405.5 $141.6
Fully Taxable
Number of Parcels 6,329 2,331 465 1,464 1,414 655
Sq. Ft. (000) 405,190.1 345,154.4 6,835.1 27,558.1 21,200.7 4,441.8
Market Value $128,076.8 $117,932.4 $1,014.2 $4,939.0 $3,594.2 $597.0
Billable AV $56,375.0 $52,077.2 $441.9 $2,041.3 $1,556.9 $257.7
Partially Taxable
Number of Parcels 508 53 80 210 123 42
Sq. Ft. (000) 23,519.4 6,897.0 2,819.9 6,559.7 6,350.7 892.2
Market Value $4,721.0 $1,926.2 $471.6 $1,187.5 $970.3 $165.4
Billable AV $1,354.6 $630.9 $107.3 $315.2 $267.9 $33.3
Exempt AV $705.1 $226.8 $98.5 $173.9 $166.3 $39.6
Fully Exempt
Number of Parcels 407 163 49 82 79 34
Sq. Ft. (000) 69,726.5 58,746.6 1,228.4 5,074.4 3,222.3 1,454.7
Market Value $20,439.1 $18,493.4 $186.8 $1,021.1 $517.7 $220.2
Exempt AV $9,650.9 $8,764.0 $87.7 $458.0 $239.2 $102.0

39
REAL PROPERTY TAX
FISCAL YEAR 2023
Table 7
OFFICE BUILDING PROFILE
FOR SELECTED AREAS
($ MILLIONS)
Sq. Ft.
Parcels (000) FMV Billable AV Exempt
MANHATTAN
Financial/WTC 84 56,265.9 $13,437.2 $2,722.4 $3,434.7
Fully Taxable 68 29,948.0 $5,790.5 $2,580.4
Partially Taxable 3 2,185.4 $398.6 $142.0 $29.2
Fully Exempt 13 24,132.6 $7,248.1 $3,405.5
Insurance/Civic Ctr 204 30,286.0 $7,164.0 $2,281.1 $958.2
Fully Taxable 182 20,660.9 $5,160.9 $2,272.7
Partially Taxable 3 204.0 $42.1 $8.4 $10.6
Fully Exempt 19 9,421.0 $1,961.0 $947.7
Midtown South 934 77,585.7 $24,953.2 $10,511.5 $388.2
Fully Taxable 898 74,597.1 $24,098.8 $10,506.7
Partially Taxable 7 101.2 $21.6 $4.8 $4.9
Fully Exempt 29 2,887.4 $832.8 $383.2
Midtown West 457 96,001.1 $30,804.1 $10,901.7 $2,911.5
Fully Taxable 441 79,769.0 $24,677.1 $10,881.6
Partially Taxable 3 417.9 $101.0 $20.1 $24.5
Fully Exempt
13 15,814.2 $6,026.0 $2,887.1
Grand Central 274 63,569.0 $23,857.2 $9,717.3 $964.6
Fully Taxable 248 56,575.0 $20,951.4 $9,328.6
Partially Taxable 5 2,474.8 $1,016.6 $388.7 $71.8
Fully Exempt 21 4,519.2 $1,889.1 $892.8
Plaza 331 78,936.8 $35,931.8 $15,867.3 $66.8
Fully Taxable 301 78,376.7 $35,778.0 $15,860.5
Partially Taxable 7 255.5 $67.1 $6.8 $23.4
Fully Exempt 23 304.6 $86.7 $43.4
BROOKLYN
Downtown 98 16,091.3 $3,385.8 $1,007.3 $413.7
Fully Taxable 74 9,794.9 $2,055.4 $845.0
Partially Taxable 8 2,221.0 $468.6 $162.2 $27.7
Fully Exempt 16 4,075.4 $861.8 $386.0

40
REAL PROPERTY TAX
FISCAL YEAR 2023
Table 8
OFFICE BUILDING PROFILE
FOR SELECTED AREAS BY OFFICE BUILDING CLASS
Parcels Sq. Ft. (000) Parcels Sq. Ft. (000) Parcels Sq. Ft. (000)
MANHATTAN
Financial/WTC 35 42,799.7 31 12,949.3 18 516.9
Fully Taxable 24 18,673.3 29 10,985.6 15 289.1
Partially Taxable 2 1,376.0 1 809.4 0 0.0
Fully Exempt 9 22,750.4 1 1,154.4 3 227.8
Insurance/Civic Ctr 17 14,467.7 32 11,630.0 155 4,188.3
Fully Taxable 13 10,575.7 22 6,482.1 147 3,603.1
Partially Taxable 0 0.0 1 155.5 2 48.6
Fully Exempt 4 3,892.0 9 4,992.5 6 536.6
Midtown South 20 7,367.3 156 36,180.3 758 34,038.1
Fully Taxable 19 6,981.4 151 34,324.7 728 33,291.0
Partially Taxable 0 0.0 0 0.0 7 101.2
Fully Exempt 1 385.8 5 1,855.6 23 646.0
Midtown West 48 46,336.1 106 30,301.5 303 19,363.5
Fully Taxable 38 30,733.4 105 30,033.1 298 19,002.5
Partially Taxable 0 0.0 1 268.4 2 149.5
Fully Exempt 10 15,602.7 0 0.0 3 211.4
Grand Central 73 45,154.0 66 14,033.3 135 4,381.7
Fully Taxable 62 38,849.3 63 13,652.2 123 4,073.5
Partially Taxable 4 2,471.5 0 0.0 1 3.3
Fully Exempt 7 3,833.2 3 381.0 11 305.0
Plaza 122 70,911.7 16 2,579.1 193 5,445.9
Fully Taxable 122 70,911.7 16 2,579.1 163 4,885.9
Partially Taxable 0 0.0 0 0.0 7 255.5
Fully Exempt 0 0.0 0 0.0 23 304.6
BROOKLYN
Downtown 20 8,964.5 34 4,815.4 44 2,311.4
Fully Taxable 11 4,630.4 27 3,578.6 36 1,585.9
Partially Taxable 2 924.3 3 717.2 3 579.5
Fully Exempt 7 3,409.8 4 519.6 5 146.0
Class A Buildings
Class B Buildings
Other Buildings

41
REAL PROPERTY TAX
FISCAL YEAR 2023
Table 9
OFFICE BUILDING PROFILE
MARKET AND ASSESSED VALUES FOR SELECTED AREAS BY OFFICE BUILDING CLASS
($ MILLIONS)
FMV Billable AV Exempt FMV Billable AV Exempt FMV Billable AV Exempt
MANHATTAN
Financial/WTC $11,066.0 $1,810.4 $3,295.0 $2,242.0 $885.2 $106.4 $129.2 $26.8 $33.3
Fully Taxable $3,843.9 $1,724.4 $1,886.6 $829.1 $60.0 $26.8
Partially Taxable $256.8 $85.9 $27.7 $141.8 $56.1 $1.5 $0.0 $0.0 $0.0
Fully Exempt $6,965.2 $3,267.3 $213.6 $104.9 $69.3 $33.3
Insurance/Civic Ctr $3,544.9 $1,201.0 $408.9 $2,638.1 $728.4 $469.6 $981.1 $351.8 $79.7
Fully Taxable $2,713.8 $1,201.0 $1,638.7 $721.5 $808.3 $350.3
Partially Taxable $0.0 $0.0 $0.0 $29.3 $6.9 $6.3 $12.8 $1.5 $4.3
Fully Exempt $831.0 $408.9 $970.0 $463.3 $159.9 $75.5
Midtown South $2,321.8 $922.3 $88.0 $13,274.3 $5,568.3 $222.1 $9,357.1 $4,020.9 $78.1
Fully Taxable $2,106.8 $922.3 $12,809.9 $5,568.3 $9,182.2 $4,016.1
Partially Taxable $0.0 $0.0 $0.0 $0.0 $0.0 $0.0 $21.6 $4.8 $4.9
Fully Exempt $215.0 $88.0 $464.4 $222.1 $153.3 $73.2
Midtown West $18,000.6 $5,305.4 $2,865.9 $8,908.8 $3,897.0 $17.6 $3,894.7 $1,699.3 $28.0
Fully Taxable $12,016.8 $5,305.4 $8,843.7 $3,885.3 $3,816.6 $1,690.9
Partially Taxable $0.0 $0.0 $0.0 $65.1 $11.7 $17.6 $35.9 $8.4 $6.9
Fully Exempt
$5,983.8 $2,865.9 $0.0 $0.0 $42.2 $21.1
Grand Central $18,501.3 $7,434.9 $865.8 $4,224.5 $1,815.9 $58.2 $1,131.4 $466.5 $40.6
Fully Taxable $15,794.4 $7,046.4 $4,106.0 $1,815.9 $1,051.0 $466.3
Partially Taxable $1,015.8 $388.5 $71.6 $0.0 $0.0 $0.0 $0.9 $0.2 $0.2
Fully Exempt $1,691.1 $794.1 $118.5 $58.2 $79.6 $40.4
Plaza $32,463.5 $14,411.2 $0.0 $1,118.9 $502.7 $0.0 $2,349.4 $953.3 $66.8
Fully Taxable $32,463.5 $14,411.2 $1,118.9 $502.7 $2,195.6 $946.6
Partially Taxable $0.0 $0.0 $0.0 $0.0 $0.0 $0.0 $67.1 $6.8 $23.4
Fully Exempt $0.0 $0.0 $0.0 $0.0 $86.7 $43.4
BROOKLYN
Downtown $1,777.5 $437.3 $331.1 $1,071.9 $378.8 $62.7 $536.4 $191.2 $20.0
Fully Taxable $862.4 $367.6 $781.9 $322.5 $411.1 $154.9
Partially Taxable $204.1 $69.7 $11.4 $172.7 $56.2 $11.6 $91.9 $36.3 $4.6
Fully Exempt $711.1 $319.6 $117.3 $51.0 $33.3 $15.4
Class A Buildings
Class B Buildings
Other Buildings
42
43
PART IV
HOME SALES

44
REAL PROPERTY TAX
Table 10
HOME SALES
CY 2022 BY QUARTER
Property Type 1Q 2022 2Q 2022 3Q 2022 4Q 2022
One-family
Number of Sales
3,307 3,450 3,201 2,575
Median Price ($)
690,000 705,000 725,000 709,000
Two-family
Number of Sales
2,556 2,572 2,367 1,881
Median Price ($)
900,000 905,000 900,000 897,000
Three-family
Number of Sales
650 663 635 493
Median Price ($)
1,127,500 1,150,000 1,180,000 1,150,000

45
REAL PROPERTY TAX
Table 11
SINGLE-FAMILY HOME SALES TRANSACTIONS AND PRICES
BY BOROUGH
CY 2003 – CY 2022
Year Manhattan Bronx Brooklyn Queens Staten Island
2003 73 1,161 2,850 8,587 4,816
2004 83 1,404 3,192 9,346 4,613
2005 70 1,279 2,961 8,965 4,204
2006 80 1,247 2,522 8,235 3,464
2007 92 893 2,128 6,628 2,934
2008 57 628 1,584 5,356 2,483
2009 51 559 1,447 5,181 2,401
2010 90 623 1,562 5,061 2,272
2011 67 573 1,405 4,363 1,571
2012 112 618 1,597 4,650 2,100
2013 95 660 1,924 5,289 2,605
2014 92 711 1,941 5,040 2,724
2015 85 890 2,145 5,688 3,270
2016 83 971 2,221 5,885 3,585
2017 85 1,052 2,315 6,246 3,866
2018 87 1,079 2,047 5,901 3,471
2019 89 1,087 2,048 5,876 3,289
2020 71 844 1,660 4,710 3,080
2021 130 1,103 2,613 6,506 4,255
2022 126 1,007 2,194 5,763 3,443
Year Manhattan Bronx Brooklyn Queens Staten Island
2003 2,575,000 260,000 325,000 325,000 304,099
2004 2,950,000 309,000 378,000 370,000 349,900
2005 4,268,750 355,000 450,000 445,000 395,000
2006 4,250,000 405,000 477,000 480,000 423,000
2007 5,305,000 418,700 518,000 500,000 419,199
2008 5,600,000 381,800 490,000 450,750 390,000
2009 4,900,000 340,000 450,000 404,000 365,000
2010 5,212,500 343,750 475,000 395,000 380,000
2011 4,600,000 330,000 471,000 395,000 375,000
2012 6,016,479 327,000 490,000 407,517 375,000
2013 4,750,000 341,000 495,000 440,000 380,000
2014 6,212,500 350,000 530,000 470,000 393,000
2015 6,000,000 363,411 595,000 481,500 401,850
2016 7,425,000 380,000 635,000 515,000 430,000
2017 6,000,000 413,700 679,000 550,000 479,000
2018 7,575,000 440,000 695,000 590,000 520,000
2019 7,225,000 475,000 707,000 605,000 523,000
2020 8,176,718 513,000 749,500 641,500 549,999
2021 7,375,000 555,000 825,000 720,000 585,000
2022 6,825,000 600,000 835,500 770,000 635,000
Sales Transactions
Median Price ($)
46
REAL PROPERTY TAX
Table 12
CITYWIDE HOME SALES BY TYPE OF PROPERTY
CY 2003 – CY 2022
Number Year/Year Number Year/Year Number Year/Year
Year of Sales % Change of Sales % Change of Sales % Change
2003 17,487 -1.3 13,916 0.9 3,626 1.6
2004 18,638 6.6 15,000 7.8 3,897 7.5
2005 17,479 -6.2 14,797 -1.4 4,042 3.7
2006 15,548 -11.0 14,089 -4.8 4,202 4.0
2007 12,675 -18.5 10,375 -26.4 3,184 -24.2
2008 10,108 -20.3 8,532 -17.8 2,465 -22.6
2009 9,639 -4.6 7,971 -6.6 1,956 -20.6
2010 9,608 -0.3 7,908 -0.8 2,071 5.9
2011 7,979 -17.0 7,051 -10.8 1,884 -9.0
2012 9,077 13.8 7,432 5.4 2,082 10.5
2013 10,573 16.5 8,692 17.0 2,539 22.0
2014 10,508 -0.6 8,823 1.5 2,599 2.4
2015 12,078 14.9 9,551 8.3 2,593 -0.2
2016 12,745 5.5 9,882 3.5 2,549 -1.7
2017 13,564 6.4 10,143 2.6 2,499 -2.0
2018 12,585 -7.2 9,454 -6.8 2,413 -3.4
2019 12,389 -1.6 9,174 -3.0 2,327 -3.6
2020 10,365 -16.3 7,176 -21.8 1,564 -32.8
2021 14,607 40.9 9,864 37.5 2,430 55.4
2022 12,533 -14.2 9,376 -4.9 2,441 0.5
Median Year/Year Median Year/Year Median Year/Year
Year
Price ($) % Change Price ($) % Change Price ($) % Change
2003 315,000 17.1 370,000 17.5 412,250 17.8
2004 360,000 14.3 430,000 16.2 499,000 21.0
2005 420,810 16.9 515,000 19.8 600,000 20.2
2006 460,000 9.3 578,000 12.2 675,000 12.5
2007 475,000 3.3 595,000 2.9 700,000 3.7
2008 430,000 -9.5 539,000 -9.4 640,996 -8.4
2009 394,000 -8.4 461,100 -14.5 562,268 -12.3
2010 395,000 0.3 445,000 -3.5 535,000 -4.8
2011 393,800 -0.3 445,000 0.0 519,500 -2.9
2012 400,000 1.6 460,000 3.4 520,000 0.1
2013 415,000 3.8 489,545 6.4 550,000 5.8
2014 430,424 3.7 525,000 7.2 615,000 11.8
2015 450,000 4.5 560,000 6.7 680,000 10.6
2016 475,000 5.6 600,000 7.1 742,500 9.2
2017 518,000 9.1 655,000 9.2 790,000 6.4
2018 556,700 7.5 700,425 6.9 860,000 8.9
2019 570,000 2.4 725,000 3.5 900,000 4.7
2020 603,000 5.8 770,000 6.2 928,500 3.2
2021 665,000 10.3 850,619 10.5 1,055,000 13.6
2022 705,000 6.0 900,000 5.8 1,150,000 9.0
Two-Family
Three-Family
One-Family
Two-Family
Three-Family
One-Family
Sales Transactions
Median Price
47
PART V
COOPERATIVE AND
CONDOMINIUM TAX
ABATEMENT PROGRAM

48
REAL PROPERTY TAX
FISCAL YEAR 2023
Table 13
COOPERATIVE AND CONDOMINIUM ABATEMENT PROGRAM
Developments
Units Abatement ($)
Developments
Units Abatement ($)
Developments
Units Abatement ($)
Cooperatives
28.1% 1,811 117,243 123,525,013 188 6,132 7,960,489 190 13,879 13,166,584
25.2% 204 10,340 14,818,288 61 1,966 3,114,725 5 372 526,494
22.5% 184 5,891 8,495,998 92 2,348 3,683,351 2 211 321,404
17.5% 2,698 119,648 348,811,327 2,339 110,229 333,001,715 2 49 53,113
TOTAL 4,897 253,122 495,650,626 2,680 120,675 347,760,280 199 14,511 14,067,595
Condominiums
28.1% 402 11,240 12,171,626 50 849 885,985 15 565 568,961
25.2% 56 1,590 2,282,495 14 276 423,995 2 65 96,250
22.5% 65 1,309 1,965,484 12 664 1,026,553 1 8 12,356
17.5% 1,660 42,004 144,013,273 1,162 35,531 129,682,545 2 141 207,794
TOTAL 2,183 56,143 160,432,878 1,238 37,320 132,019,078 20 779 885,361
All Apartments
28.1% 2,213 128,483 135,696,639 238 6,981 8,846,474 205 14,444 13,735,545
25.2% 260 11,930 17,100,783 75 2,242 3,538,720 7 437 622,744
22.5% 249 7,200 10,461,482 104 3,012 4,709,904 3 219 333,760
17.5% 4,358 161,652 492,824,600 3,501 145,760 462,684,260 4 190 260,907
TOTAL 7,080 309,265 656,083,504 3,918 157,995 479,779,358 219 15,290 14,952,956
Developments
Units Abatement ($)
Developments
Units Abatement ($)
Developments
Units Abatement ($)
Cooperatives
28.1% 743 28,874 30,466,053 673 66,926 70,813,034 17 1,432 1,118,853
25.2% 86 3,278 4,459,407 52 4,724 6,717,662 0
22.5% 74 2,106 2,789,795 15 1,209 1,683,081 1 17 18,367
17.5% 344 6,973 12,083,105 13 2,397 3,673,394 0
TOTAL 1,247 41,231 49,798,360 753 75,256 82,887,171 18 1,449 1,137,220
Condominiums
28.1% 187 2,386 2,615,834 124 6,045 6,832,054 26 1,395 1,268,792
25.2% 29 278 428,903 11 971 1,333,347 0
22.5% 40 312 484,078 12 325 442,497 0
17.5% 465 5,138 12,083,105 31 1,194 2,039,829 0
TOTAL 721 8,114 15,611,920 178 8,535 10,647,727 26 1,395 1,268,792
All Apartments
28.1% 930 31,260 33,081,887 797 72,971 77,645,088 43 2,827 2,387,645
25.2% 115 3,556 4,888,310 63 5,695 8,051,009 0
22.5% 114 2,418 3,273,873 27 1,534 2,125,578 1 17 18,367
17.5% 809 12,111 24,166,210 44 3,591 5,713,223 0
TOTAL 1,968 49,345 65,410,280 931 83,791 93,534,898 44 2,844 2,406,012
Level
Level
Abatement
Abatement
Citywide
Manhattan
Bronx
Brooklyn
Queens
Staten Island
49
PART VI
PROPERTY TAX
DELINQUENCIES
50
Property Tax Delinquencies
Property tax delinquencies reflect the amount of property tax that is due but not yet
collected. Delinquencies may be attributable to tax amounts owed for the current fiscal
year or prior fiscal years, and reflect the status of payments at a given point in time. For
the FY 2023 report onwards, all delinquency amounts do not include calculated interest.
This section presents property tax delinquencies reported as of June 30
th
of a year for the
“current fiscal year.” Since the levy changes each year, this allows for a meaningful year-
to-year comparison. Properties that are in a payment plan at the time of reporting are not
classified as delinquent.
51
REAL PROPERTY TAX
Table 14
TAX DELINQUENCY COMPARISON BY FISCAL YEAR
FOR FISCAL YEARS 2022, 2021 AND 2020 AS OF JUNE 30
1,2
FY2022 FY2021 FY2020 FY2022 FY2021 FY2020 FY2022 FY2021 FY2020
First Quarter 32,990 40,813 29,360 $150.8 $189.8 $113.7 1.18% 1.40% 0.93%
Second Quarter
36,742 42,725 32,294 $54.4 $60.5 $44.5 2.30% 2.65% 2.18%
Third Quarter 57,003 57,727 48,464 $257.0 $321.6 $203.5 2.03% 2.35% 1.66%
Fourth Quarter 73,410 72,669 65,953 $113.2 $111.5 $91.3 5.01% 4.97% 4.45%
Total $575.5 $683.4 $453.1 1.91% 2.15% 1.59%
FY2022 FY2021 FY2020 FY2022 FY2021 FY2020 FY2022 FY2021 FY2020
Class One 45,285 47,925 43,563 $143.3 $156.0 $125.1 3.16% 3.38% 2.90%
Class Two 21,614 21,428 17,017 $222.7 $249.4 $177.6 1.91% 2.12% 1.71%
Class Three 10 3 6 $0.6 $0.0 $0.0 0.03% 0.00% 0.00%
Class Four 15,802 15,395 12,589 $208.9 $278.0 $150.5 1.79% 2.10% 1.28%
Total 83,226 85,256 73,175 $575.5 $683.4 $453.1 1.91% 2.15% 1.59%
FY2022 FY2021 FY2020 FY2022 FY2021 FY2020 FY2022 FY2021 FY2020
Manhattan 11,846 12,158 9,406 $218.6 $278.6 $149.6 1.23% 1.45% 0.86%
Bronx 8,594 8,897 7,809 $54.4 $54.1 $40.8 3.16% 3.04% 2.58%
Brooklyn 28,680 28,819 24,790 $155.5 $187.5 $135.7 3.39% 4.06% 3.31%
Queens 25,462 26,248 23,306 $121.1 $132.9 $103.7 2.47% 2.65% 2.30%
Staten Island 8,129 8,629 7,864 $25.8 $30.3 $23.3 2.40% 2.78% 2.31%
Total 83,226 85,256 73,175 $575.5 $683.4 $453.1 1.91% 2.15% 1.59%
Delinquency
Delinquency Rate
Parcels
3
($ millions)
(Percent of Final Levy Billed)
4
Quarter
Delinquency
Delinquency Rate
Parcels
($ millions)
(Percent of Final Levy Billed)
4
Borough
Tax Class
Delinquency
Delinquency Rate
Parcels
($ millions)
(Percent of Final Levy Billed)
4
1.
In previous years’ reports, total delinquency included calculated interest and parcels that were in payment plans. For FY
2023's report onwards, for all years, parcels in payment plans are no longer classified as delinquent and calculated
interest is excluded from the delinquency amounts.
2. Delinquency is for each year’s tax charges and does not include prior
-year delinquencies. There may be a small number
of payments in suspense, which are not included in this table.
3.
Parcels delinquent on their tax bill in each quarter; a parcel may be delinquent for multiple quarters and is counted in
each quarter in which it is delinquent.
4.
Final Levy Billed equals tax levy minus abatements and cancellations (Tax Commission reductions, court orders, and
settlements, Department of Finance adjustments and rebilling adjustments).

52
REAL PROPERTY TAX
Table 15
CITYWIDE REAL PROPERTY TAX DELINQUENCIES
1,2
FOR SELECTED PROPERTY TYPES
FOR FISCAL YEARS 2022 AND 2021 AS OF JUNE 30
Delinquency Delinquency Delinquency Delinquency
Parcels ($ millions)
Rate
3
Parcels ($ millions)
Rate
3
CLASS 1
1-Family 17,292 $56.4 2.8% 18,515 $62.6 3.0%
2-Family 14,774 $49.0 2.9% 15,735 $54.2 3.2%
3-Family 4,916 $22.1 3.9% 5,177 $21.7 3.8%
Condominiums 1,432 $2.7 3.2% 1,411 $2.8 3.2%
Res. Multi Use 2,247 $9.0 5.6% 2,357 $10.1 6.2%
Vacant Land 4,128 $3.5 15.6% 4,222 $3.9 16.3%
CLASS 2
Walk-ups 4,871 $71.0 3.1% 4,992 $73.4 3.1%
Elevator 428 $33.8 1.0% 472 $47.5 1.3%
Cooperatives 686 $18.3 0.6% 689 $22.7 0.8%
Condominiums 14,276 $83.1 3.3% 13,868 $90.2 3.7%
Res. Multi Use 1,335 $16.2 5.1% 1,388 $15.4 5.0%
CLASS 4
Office Buildings 631 $27.1 0.5% 645 $24.8 0.4%
Store Buildings 2,253 $42.3 2.7% 2,185 $56.4 3.0%
Hotels 109 $39.7 5.2% 127 $55.4 5.7%
Factories 433 $6.1 3.2% 460 $8.6 4.1%
Comm'l Condos 7,480 $30.9 1.6% 6,816 $45.7 2.1%
Garages 1,587 $13.0 4.5% 1,689 $18.6 5.9%
Warehouses 665 $8.1 1.9% 694 $12.7 2.9%
Vacant Land 1,201 $8.8 7.5% 1,292 $13.5 11.3%
Hospitals & Health 76 $6.0 4.0% 64 $4.8 3.2%
Educational 93 $4.0 4.9% 117 $7.6 8.3%
Theaters 6 $0.4 0.9% 11 $0.9 1.8%
FY2022 as of 6/30/2022
FY2021 as of 6/30/2021
1.
In previous years’ reports, total delinquency included calculated interest and parcels that were in payment
plans. For FY 2023's report onwards, for all years, parcels in payment plans are no longer classified as
delinquent and calculated interest is excluded from the delinquency amounts.
2. Delinquency is for each year’s tax charges and does not include prior
-year delinquencies. There may be a
small number of payments in suspense, which are not included in this table.
3.
The delinquency rate is the percent of final levy billed. The final levy billed equals tax levy minus abatements
and cancellations (Tax Commission reductions, court orders, and settlements, Department of Finance
adjustments and rebilling adjustments).
53
PART VII
HISTORICAL DATA

54
REAL PROPERTY TAX
Table 16
MARKET VALUES
1
BY TAX CLASS AND BOROUGH
FY 2004 – FY 2023
($ MILLIONS)
Fiscal
Year Total Class 1 Class 2 Class 3 Class 4
2004 466,677.7 232,904.4 97,425.6 15,622.4 120,725.2
2005 540,384.4 283,559.0 115,880.3 16,657.2 124,288.0
2006 614,003.7 325,068.5 131,377.0 18,909.9 138,648.3
2007 674,091.6 367,055.5 140,940.4 20,189.6 145,906.1
2008 795,932.4 426,889.3 175,753.9 19,612.2 173,677.1
2009 811,141.3 422,822.2 186,043.7 22,378.7 179,896.7
2010 795,657.3 401,679.9 182,296.9 24,029.1 187,651.4
2011 793,741.6 390,337.1 188,766.6 25,374.0 189,264.0
2012 814,422.1 393,683.4 189,482.8 24,893.6 206,362.2
2013 838,003.2 400,288.2 195,251.4 26,102.5 216,361.1
2014 858,102.4 396,854.7 202,479.4 28,192.8 230,575.5
2015 906,273.8 415,225.8 215,863.9 28,438.7 246,745.5
2016 969,430.4 442,358.5 234,465.6 30,721.1 261,885.3
2017 1,064,244.5 496,340.2 256,799.9 32,328.3 278,776.1
2018 1,149,208.8 538,564.7 281,500.4 33,285.7 295,858.0
2019 1,250,706.9 594,342.2 309,666.0 34,368.7 312,330.0
2020 1,315,907.5 630,833.1 329,152.6 37,518.1 318,403.7
2021 1,369,384.2 657,429.3 347,661.8 38,312.7 325,980.3
2022 1,292,293.8 662,567.2 319,084.8 41,447.6 269,194.2
2023 1,393,644.1 706,585.3 347,972.3 43,701.2 295,385.2
Fiscal
Year Manhattan Bronx Brooklyn Queens Staten Island
2004 167,674.5 31,635.9 101,292.7 127,371.2 38,703.4
2005 180,730.2 35,155.0 125,473.3 153,488.1 45,537.9
2006 205,579.4 40,000.8 141,576.4 174,669.5 52,177.5
2007 217,973.3 43,551.6 158,013.6 198,437.3 56,115.8
2008 252,826.4 55,006.3 200,697.0 221,951.5 65,451.2
2009 271,745.4 57,892.5 198,716.3 219,644.8 63,142.2
2010 277,268.0 53,928.8 198,526.0 205,378.5 60,556.0
2011 287,173.5 51,149.6 196,375.4 199,702.7 59,340.3
2012 308,569.0 51,170.1 192,463.1 203,069.2 59,150.9
2013 321,589.2 52,282.3 198,498.1 206,464.8 59,168.8
2014 339,531.3 53,648.2 200,325.9 206,782.5 57,814.5
2015 362,524.3 54,965.1 213,798.7 216,055.7 58,930.1
2016 389,710.0 58,474.4 228,447.5 232,108.8 60,689.8
2017 420,552.2 61,656.1 264,149.8 254,172.9 63,713.5
2018 450,675.1 65,795.1 299,195.5 266,919.4 66,623.6
2019 480,389.4 71,574.4 333,283.7 292,805.0 72,654.4
2020 495,041.7 75,321.7 348,507.5 317,044.8 79,991.8
2021 508,176.3 80,905.4 371,802.4 326,250.1 82,250.0
2022 443,558.2 78,185.7 361,909.9 325,238.7 83,401.2
2023 473,172.8 86,344.1 396,242.4 347,792.5 90,092.4
1. Market values represent values for fully and partially taxable properties only.
Tax Class
Borough

55
REAL PROPERTY TAX
Table 17
ACTUAL AND BILLABLE ASSESSED VALUE BY TAX CLASS
FY 2004 – FY 2023
($ MILLIONS)
Fiscal Year Total Class 1 Class 2 Class 3 Class 4
2004 106,789.5 11,132.5 37,738.2 7,021.6 50,897.1
2005 110,316.4 11,547.1 39,108.8 7,488.7 52,171.8
2006 122,481.6 12,146.9 43,941.4 8,502.0 57,891.3
2007 127,637.0 12,712.6 45,048.7 9,078.4 60,797.3
2008 145,585.9 13,289.3 51,260.2 8,725.2 72,311.2
2009 151,998.6 13,955.3 53,457.0 9,589.1 74,997.1
2010 157,952.6 14,417.8 55,055.0 10,450.8 78,029.1
2011 159,695.6 14,952.7 55,530.8 11,036.0 78,176.1
2012 171,355.6 15,293.9 60,102.9 10,875.3 85,083.5
2013 179,123.6 15,784.7 62,215.4 11,349.0 89,774.4
2014 190,197.2 16,229.0 65,564.7 12,244.5 96,158.9
2015 202,862.4 16,915.4 70,514.5 12,355.1 103,077.4
2016 217,642.6 17,727.6 77,316.8 13,476.6 109,121.6
2017 234,541.7 18,393.9 85,118.5 14,203.3 116,826.1
2018 251,482.9 19,442.8 92,585.8 14,683.9 124,770.4
2019 267,704.7 20,146.8 100,491.1 15,225.6 131,841.2
2020 281,048.4 21,042.9 107,146.0 16,649.3 136,210.1
2021 291,353.3 22,018.2 112,123.5 17,064.6 140,146.9
2022 259,988.0 22,801.4 102,628.9 18,484.9 116,072.9
2023 283,995.8 23,699.0 113,024.4 19,508.5 127,763.8
Fiscal Year Total Class 1 Class 2 Class 3 Class 4
2004 98,634.5 11,132.5 34,151.9 7,021.6 46,328.4
2005 102,367.3 11,547.1 35,950.8 7,488.7 47,380.7
2006 110,014.1 12,146.9 38,630.6 8,502.0 50,734.6
2007 115,119.3 12,712.6 40,528.3 9,078.4 52,800.0
2008 124,461.4 13,289.3 43,751.6 8,725.2 58,695.3
2009 132,996.7 13,955.3 46,544.1 9,589.1 62,908.1
2010 141,848.5 14,417.8 49,267.8 10,450.8 67,712.2
2011 147,629.2 14,952.7 50,771.3 11,036.0 70,869.2
2012 155,416.4 15,293.9 53,697.0 10,875.3 75,550.2
2013 162,345.5 15,784.7 55,880.9 11,349.0 79,330.8
2014 171,747.6 16,229.0 58,921.5 12,244.5 84,352.6
2015 182,514.7 16,915.4 63,037.3 12,355.1 90,206.9
2016 195,185.4 17,727.6 67,943.2 13,476.6 96,038.0
2017 208,611.1 18,393.9 73,978.9 14,203.3 102,035.1
2018 224,461.3 19,442.8 81,049.9 14,683.9 109,284.7
2019 239,729.3 20,146.8 88,220.1 15,225.6 116,136.8
2020 256,588.3 21,042.9 96,097.5 16,649.3 122,798.5
2021 270,793.7 22,018.2 102,509.6 17,064.6 129,201.3
2022 256,679.3 22,801.4 101,239.3 18,484.9 114,153.7
2023 274,786.1 23,699.0 108,322.5 19,508.5 123,256.1
Taxable Billable Assessed Value
Taxable Actual Assessed Value

56
REAL PROPERTY TAX
Table 18
TAXABLE BILLABLE ASSESSED VALUE BY BOROUGH
FY 2004 – FY 2023
($ MILLIONS)
Fiscal
Year Citywide Manhattan Bronx Brooklyn Queens
Staten Island
2004 98,634.5 60,412.5 5,723.7 12,965.0 16,229.1 3,304.2
2005 102,367.3 63,157.1 5,882.7 13,304.0 16,611.4 3,412.2
2006 110,014.1 67,876.4 6,438.9 14,063.0 17,938.6 3,697.2
2007 115,119.3 71,222.8 6,696.3 14,790.0 18,513.1 3,897.1
2008 124,461.2 76,894.3 7,250.9 16,200.9 19,910.6 4,204.5
2009 132,996.7 82,047.6 8,204.9 17,253.0 21,106.8 4,384.5
2010 141,848.5 88,354.9 8,663.5 18,252.7 22,027.9 4,549.5
2011 147,629.2 93,165.9 8,290.2 18,891.9 22,566.1 4,715.1
2012 155,416.4 99,099.5 8,599.5 19,653.2 23,221.8 4,842.5
2013 162,345.5 104,108.8 8,722.9 20,563.2 24,011.6 4,939.0
2014 171,747.6 111,053.7 9,224.6 21,403.0 24,941.3 5,124.9
2015 182,514.7 118,509.4 9,737.9 22,774.2 26,184.1 5,309.2
2016 195,185.4 127,314.3 10,474.8 24,258.5 27,664.9 5,472.8
2017 208,611.1 136,618.0 10,893.2 26,098.2 29,332.4 5,669.3
2018 224,461.3 147,092.4 11,660.2 28,446.4 31,249.6 6,012.6
2019 239,729.3 156,831.3 12,607.2 30,836.1 33,156.4 6,298.3
2020 256,588.3 167,275.4 13,391.9 33,773.0 35,385.8 6,762.2
2021 270,793.7 174,942.6 14,389.9 36,675.1 37,677.7 7,108.3
2022 256,679.3 161,157.4 14,078.4 36,821.4 37,409.7 7,212.4
2023 274,786.1 171,242.5 15,241.6 40,220.5 40,321.8 7,759.7
Borough

57
REAL PROPERTY TAX
Table 19
TAX LEVY DISTRIBUTION BY CLASS
FY 2004 – FY 2023
Fiscal
Year Total Class 1 Class 2 Class 3 Class 4
2004 100.0 14.0902 35.5629 7.1175 43.2294
2005 100.0 14.6854 34.8724 7.3902 43.0520
2006 100.0 14.9461 35.4295 7.6566 41.9678
2007 100.0 15.2298 36.5105 7.6277 40.6320
2008 100.0 15.1181 36.7185 7.0359 41.1275
2009 100.0 14.9557 37.2143 7.3186 40.5114
2010 100.0 14.8231 37.4672 7.5717 40.1380
2011 100.0 15.0922 37.4175 7.6075 39.8828
2012 100.0 15.3852 37.8064 7.0338 39.7746
2013 100.0 15.4619 36.9663 7.0332 40.5386
2014 100.0 15.4894 36.7523 6.8468 40.9115
2015 100.0 15.0728 36.1823 6.0842 42.6607
2016 100.0 15.0321 36.5486 6.0353 42.3840
2017 100.0 14.8922 37.2591 6.0207 41.8280
2018 100.0 14.8429 37.4190 6.2975 41.4406
2019 100.0 14.6808 37.8078 6.2255 41.2859
2020 100.0 14.4514 38.0398 6.5989 40.9099
2021 100.0 14.2228 37.8149 6.5586 41.4037
2022 100.0 14.7206 39.2894 7.1806 38.8094
2023 100.0 14.5206 39.3688 7.3500 38.7606
Fiscal
Year Total Class 1 Class 2 Class 3 Class 4
2004 12,250.7 1,726.1 4,356.7 871.9 5,295.9
2005 12,720.0 1,868.0 4,435.8 940.0 5,476.2
2006 13,668.1 2,042.9 4,842.5 1,046.5 5,736.2
2007 14,291.2 2,176.5 5,217.8 1,090.1 5,806.8
2008 14,356.3 2,170.4 5,271.4 1,010.1 5,904.4
2009 15,903.5 2,378.5 5,918.4 1,163.9 6,442.7
2010 17,588.1 2,607.1 6,589.8 1,331.7 7,059.5
2011 18,323.8 2,765.4 6,856.3 1,394.0 7,308.1
2012 19,284.5 2,967.0 7,290.8 1,356.4 7,670.4
2013 20,133.1 3,113.0 7,442.5 1,416.0 8,161.7
2014 21,285.2 3,297.0 7,822.8 1,457.4 8,708.1
2015 22,591.5 3,405.2 8,174.1 1,374.5 9,637.7
2016 24,145.0 3,629.5 8,824.7 1,457.2 10,233.6
2017 25,794.1 3,841.3 9,610.6 1,553.0 10,789.1
2018 27,726.2 4,115.4 10,374.9 1,746.1 11,489.9
2019 29,574.7 4,341.8 11,181.5 1,841.2 12,210.2
2020 31,629.8 4,571.0 12,031.9 2,087.2 12,939.7
2021 33,371.4 4,746.4 12,619.4 2,188.7 13,817.0
2022 31,636.0 4,657.0 12,429.6 2,271.7 12,277.8
2023 33,853.7 4,915.8 13,327.8 2,488.2 13,121.9
Class Shares (%)
Class Levies ($ millions)

58
REAL PROPERTY TAX
Table 20
REAL PROPERTY TAX RATES
(PER $100 OF ASSESSED VALUE)
FY 2004 – FY 2023
Fiscal
Year Citywide Class 1 Class 2 Class 3 Class 4
2004 12.283 14.550 12.620 12.418 11.431
2005 12.283 15.094 12.216 12.553 11.558
2006 12.283 15.746 12.396 12.309 11.306
2007 12.283 16.118 12.737 12.007 10.997
2008 11.423 15.434 11.928 11.577 10.059
2009 1st half 11.423 15.605 12.139 11.698 9.870
2009 2nd half 12.283 16.787 13.053 12.577 10.612
2010 12.283 17.088 13.241 12.743 10.426
2011 12.283 17.364 13.353 12.631 10.312
2012 12.283 18.205 13.433 12.473 10.152
2013 12.283 18.569 13.181 12.477 10.288
2014 12.283 19.191 13.145 11.902 10.323
2015 12.283 19.157 12.855 11.125 10.684
2016 12.283 19.554 12.883 10.813 10.656
2017 12.283 19.991 12.892 10.934 10.574
2018 12.283 20.385 12.719 11.891 10.514
2019 12.283 20.919 12.612 12.093 10.514
2020 12.283 21.167 12.473 12.536 10.537
2021 12.283 21.045 12.267 12.826 10.694
2022 12.283 19.963 12.235 12.289 10.755
2023 12.283 20.309 12.267 12.755 10.646
Tax Class

59
REAL PROPERTY TAX
Table 21
REAL PROPERTY TAX LEVY AND REVENUE
(Including STAR)
FY 2004 – FY 2023
Revenue
Fiscal Tax Levy
Revenue
1
as Percent
Year ($ millions) ($ millions) of Levy
2004 12,250.7 11,582.3 94.5
2005 12,720.0 11,615.9 91.3
2006 13,668.1 12,636.4 92.5
2007 14,291.2 13,122.8 91.8
2008 14,356.2 13,203.9 92.0
2009 15,903.5 14,487.2 91.1
2010 17,588.1 16,369.4 93.1
2011 18,323.7 17,086.5 93.2
2012 19,284.6 18,157.7 94.2
2013 20,133.1 18,969.6 94.2
2014 21,285.2 20,202.0 94.9
2015 22,591.5 21,517.9 95.2
2016 24,145.0 23,180.6 96.0
2017 25,794.1 24,679.4 95.7
2018 27,726.2 26,407.6 95.2
2019 29,574.7 27,884.7 94.3
2020 31,629.8 29,815.9 94.3
2021 33,371.4 31,464.5 94.3
2022 31,636.0 29,582.2 93.5
2023 33,853.7 31,569.9
93.3
1. Property tax rebates are excluded from revenues.
2. Revised to reflect actual revenue.
3. Estimated based on FY 2024 Executive Budget.

60
REAL PROPERTY TAX
Table 22
DETERMINATION OF THE UNUSED OPERATING MARGIN
FY 2004 – FY 2023
($ MILLIONS)
Expenses 2.5% of
Subject to Five-year
Total Debt Operating Tax Operating Avg. Market BID Operating
Fiscal Levy Service Expenses
Abatement
1
Limit
Value
2
Charges
3
Limit Dollars Percent
Year (1) (2) (3) =(1)-(2) (4) (5)=(3)-(4) (6) (7) (8)=(6)-(7) (9)=(8)-(5) (10)=(9/8)
2004 12,250.7 2,821.2 9,429.5 9,429.5 9,997.7 62.1 9,935.6 506.1 5.1%
2005 12,720.0 2,485.6 10,234.4 581.0 9,653.4 10,778.8 63.3 10,715.5 1,062.1 9.9%
2006 13,668.1 1,141.0 12,527.1 868.0 11,659.1 11,762.7 70.3 11,692.4 33.3 0.3%
2007 14,291.2 221.0 14,070.2 939.2 13,131.0 13,333.9 72.8 13,261.1 130.1 1.0%
2008 14,356.2 2,952.1 11,404.1 941.7 10,462.4 15,025.6 76.6 14,949.0 4,486.6 30.0%
2009 15,903.5 1,168.9 14,734.6 945.0 13,789.6 17,604.7 79.0 17,525.7 3,736.1 21.3%
2010 17,588.1 295.8 17,292.4 823.0 16,469.4 18,726.1 84.5 18,641.6 2,172.2 11.7%
2011 18,323.7 921.2 17,402.5 914.0 16,488.5 19,056.1 83.0 18,973.1 2,484.6 13.1%
2012 19,284.6 1,135.5 18,149.1 968.0 17,181.1 19,024.2 88.2 18,936.0 1,754.9 9.3%
2013 20,133.1 2,896.2 17,236.9 976.6 16,260.3 19,213.2 93.8 19,119.4 2,859.1 15.0%
2014 21,285.2 1,435.8 19,849.4 995.0 18,854.4 19,775.1 98.8 19,676.3 821.9 4.2%
2015 22,591.5 3,623.5 18,968.0 966.3 18,001.7 20,338.7 100.0 20,238.7 2,236.9 11.1%
2016 24,145.0 2,310.6 21,834.4 1,009.5 20,824.9 21,296.0 101.5 21,194.5 369.6 1.7%
2017 25,794.1 2,353.6 23,440.5 1,062.3 22,378.2 22,559.0 106.6 22,452.4 74.2 0.3%
2018 27,726.2 2,600.0 25,126.2 1,121.0 24,005.2 24,560.4 111.7 24,448.7 443.5 1.8%
2019 29,574.7 2,095.6 27,479.1 1,204.5 26,274.6 26,560.7 123.1 26,437.7 163.1 0.6%
2020 31,629.8 2,448.5 29,181.3 1,377.5 27,803.8 29,066.4 130.2 28,936.2 1,132.5 3.9%
2021 33,371.4 2,872.0 30,499.4 1,538.5 28,960.9 30,754.4 140.1 30,614.3 1,653.4 5.4%
2022 31,636.0 852.1 30,783.9 1,442.3 29,341.6 31,838.0 142.8 31,695.2 2,353.6 7.4%
2023 33,853.7 905.4 32,948.3 1,564.8 31,383.5 31,861.9 147.5 31,714.4 330.9 1.0%
Beginning in FY 2005, the unused margin includes an adjustment for abatements.
1. Includes Property Tax Reserve items from the Tax Fixing Resolution: Coop/Condo Abatement; STAR; J-51; SCRIE/DRIE; Commercial Revitalization
Program; Section 626; ICAP; Solar/Green Roof abatement; and Exempt Property Restored.
2. Computed by taking 2.5% of NYS ORPTS full market valuations for the last completed assessment roll and the four preceding assessment rolls.
3. Business Improvement District (BID) charges are self-imposed assessments within each district and subject to the constitutional 2.5 percent limit for
operating purposes.
Operating Margin
Calculation of Expenses Subject to Operating Limit
Calculation of Operating Limit
Unused

61
REAL PROPERTY TAX
Table 23
CLASS SHARE ADJUSTMENT CAP
1
FY 2004 – FY 2023
Fiscal Year
Cap
(Percent)
2004 2.00
2005 5.00
2006 2.00
2007 2.00
2008 0.00
2009 0.00
2010 0.00
2011
2.50
2012 2.50
2013 1.50
2014 1.00
2015 5.00
2016 5.00
2017 5.00
2018 0.00
2019 0.50
2020 0.00
2021 0.50
2022 5.00
2023 0.00
1. Article 18 of Real Property Tax Law requires that the adjusted base proportions of the
four real property tax classes in the City (which determine the share of the total tax levy
payable by each class) be revised each year to reflect relative changes in market values,
subject to a 5 percent cap on the increase in any class’s share of the levy. In some
years, special State legislation has resulted in a class share cap that is lower than the 5
percent default cap.
62
63
APPENDICES

64
Appendix A
THE REAL PROPERTY TAX CLASS SYSTEM AT A GLANCE
These limitations apply only to equalization increases. There are no limitations on assessment
increases resulting from new construction, alterations, or the restoration of exempt property to the
tax roll. However, with respect to existing Class Two buildings with fewer than 11 residential units, an
increase in assessed value due to additions or improvements is limited to one-third of the increase
that would otherwise apply. The balance of such increase is subject to the limitations that apply to
equalization increases on such properties. In addition, eligible properties that were damaged in
2012 by Superstorm Sandy may qualify for assessed value adjustments that limit increases due to
repair or reconstruction work. The adjustments, which apply to assessment rolls completed in 2014
through 2020, are designed to assure that assessment increases do not exceed the amounts that would
have been permitted had the storm not occurred.
Class 1
Definition: (1) One-, two-, and three-family homes; (2) Single-family homes on cooperatively-owned
land; (3) Condominiums with no more than 3 dwelling units, provided such property was previously
classified as Class 1, or no more than 3 stories high and built as condominiums; (4) Mixed-use property
with 3 units or less, provided 50 percent or more of the space is used for residential purposes; and (5)
Except in Manhattan, vacant land that is residentially zoned, or if not residentially zoned, that abuts a
Class 1 parcel, has the same owner as that parcel, and is not larger than 10,000 square feet.
Assessment Limitations: Assessment increases cannot exceed 6 percent annually and 20 percent over
any five-year period.
Class 2
Definition: (1) All residential property not in Class 1, except hotels and motels; (2) Mixed-use property
with 4 or more units, provided 50 percent or more of the space is used for residential purposes.
Assessment Limitations: For buildings with fewer than 11 units, including rentals, cooperatives and
condominiums, assessment increases cannot exceed 8 percent annually and 30 percent over any five-
year period. For all other Class 2 properties, there are no limitations on assessment increases; however,
any increase must be phased-in over a five-year period. Unless specifically excluded, Section 581 of the
Real Property Tax Law prohibits the use of sales data that reflect actual or potential cooperative or
condominium ownership in the assessment of multiple-family housing.
Class 3
Definition: Utility real property owned by utility corporations, except land and buildings
Assessment Limitations: There are no limitations on assessment increases and no phase-in
requirements.
Class 4
Definition: All other real property.
Assessment Limitations: There are no limitations on assessment increases; however, increases must
be phased-in over a five-year period.

65
Appendix B
A CHRONOLOGY OF TAX CLASS CHANGES
Fiscal
Year Property Type Modification From To
1985 Residential properties containing Subclassification, imposition of -- --
4-6 dwelling units (Class Two). assessment increase limitations.
1986 Condominiums of three stories or Reclassification. Two One
less and built as condominiums.
1987 Residential properties containing Subclassification, imposition of -- --
7-10 dwelling units (Class Two). assessment increase limitations.
1988- Central office and telecommunications Redefinition of real property subject to -- --
1993 equipment. taxation, excluding these properties
from the assessment roll. However,
the legislation maintained these
properties on the fiscal 1988 and
1989 tax rolls at their fiscal 1987
taxable assessed value. Commencing
with the fiscal 1990 assessment roll,
these properties were phased out over
four years, at 25% per year.
1991 Land and structures owned by utility Reclassification. Three Four
companies.
1991 Condominiums with no more than Reclassification. Two One
three residential units, provided such
property was previously classified as
Class One.
1991 a) Residentially zoned vacant land, Reclassification. Four One
except such land located in Man-
hattan south of or adjacent to the
south side of 110th Street.
b) Non-residentially zoned vacant
land, provided the property (1) is
situated immediately adjacent to a
property improved with a Class One
structure, (2) is owned by the same
owner as the improved lot prior to
and since 1/1/89, and (3) has no
more than 10,000 square feet, except
such land located in Manhattan south
of or adjacent to the south side of
110th Street.
1992 Mixed commercial/residential Reclassification.
properties where at least 50% of total
square footage is used for residential
purposes.
a) If three units or less Four One
b) If more than three units Four Two
1992 Single-family homes on cooperatively- Reclassification. Two One
owned land.
1994 Class Two cooperatives and Subclassification, imposition of -- --
condominiums in buildings with 2-10 assessment increase limitations.
units.
2006 Existing Class Two buildings with fewer Limitation on assessment increase -- --
than 11 residential units. due to additions or improvements to
the property.
2010 Vacant land in Manhattan above 110th Reclassification. One Four
St. that was classified in Class One on
the 2008-2009 tax roll (with a limited
and temporary exception for certain
land to be used for the construction of
affordable housing for low-income
families).
66
Appendix C
Glossary of Common Property Terms
Abatement - A reduction in property tax liability through a credit rather than a reduction in
taxable assessed value. City abatements include the J-51 housing rehabilitation abatement,
the Senior Citizen Rent Increase Exemption, the Lower Manhattan Revitalization abatement,
the Industrial and Commercial abatements and the Cooperative and Condominium
abatements.
Actual Assessed Value - The assessment established for all tax classes and without regard to
the five-year phase-in requirement for most Class Two and all Class Four properties.
Adjusted Base Proportion - The redistribution of the tax levy among the four tax classes,
adjusted for market value trends.
Ad Valorem Tax - A tax based on the value of the object being taxed. The real property tax
is an ad valorem tax.
Article 18 - The portion of the New York State Real Property Tax Law that established the
classification system in New York City and Nassau County. The Article contains definitions
of each tax class, imposes assessment limitations, and spells out the method of distributing
the tax levy.
Assessed Value - The value of a property for real property taxation purposes. In New York
City, property may have three assessed values: actual assessed value, transition assessed
value, and billable assessed value (see definitions).
Assessment Ratio - The ratio of assessed value to market value.
Assessment Roll - The public record of all properties in a taxing jurisdiction and their
assessed values.
Base Proportion - Under Article 18 of the Real Property Tax Law, the taxable assessed value
of each tax class as a proportion of total taxable assessed value in a base year. These
proportions establish the basis for the distribution of the tax levy among the four tax classes.
Billable Assessed Value - The assessed value on which tax liability is based. For properties
in Classes Two or Four, the billable assessed value is the lower of the actual or transitional
assessed value.
Capitalization - The process by which anticipated future income and benefits are converted
to a present value.
Capitalization Rate - A rate of return used to produce the capital value of an income stream.
67
Class Share - The proportion of the tax levy allocated to a tax class.
Comparable Sales Method (Market Approach) - The process by which a property's market
value is estimated based on the sales prices of similar (comparable) properties.
Condominium - A form of ownership that combines individual ownership of residential or
commercial units with joint ownership of common areas such as hallways, etc.
Cooperative - A form of corporate ownership of real property whereby shareholders are
entitled to use dwelling units or other units of space.
Cost Approach - A method of valuing real property, by estimating the reproduction or
replacement cost of the improvement, as adjusted for depreciation, obsolescence, etc., plus
the site value.
Debt Service - The amount required to repay principal and interest on the City's outstanding
debt.
Delinquency - The amount of tax liability that remains outstanding after the due date,
allowing for any grace period, if applicable.
Demolition - Destruction and removal of an existing improvement.
Depreciation - In appraisal, a charge against the reproduction cost of an improvement for
estimated wear and obsolescence.
Due Date - The date on which an obligation must be satisfied.
Equalization - Changes in assessed value made by a taxing jurisdiction to ensure that all
properties (or all properties within a tax class, if applicable) are assessed at the same
percentage of market value.
Exemption - A provision of law that reduces taxable value or income.
Exempt Value - The amount or percentage of assessed value that is not subject to taxation.
Property may be fully exempt or partially exempt.
Fiscal Year - A 12-month period used for financial reporting. The City's fiscal year runs from
July 1 to June 30.
Fractional Assessment - Assessment of real property at a percentage of market value (i.e., at
less than 100 percent of market value).
Grace Period - The period of time, beyond the due date, in which a payment may be made
without incurring a penalty.
68
Improvements - Additions to raw land that increase value. Improvements include buildings,
streets, sewers, etc.
Income Capitalization Approach - A method of valuing property by discounting net
operating income to arrive at a present worth estimate.
In Rem - A Latin term meaning "against the thing." A proceeding directly against the
property rather than the owner of such property. In tax foreclosures, in rem proceedings are
used by the City to enforce payment of delinquent property taxes and related charges.
Levy - An assessment of tax.
Liability - A debt or financial obligation.
Market Value - The most probable price that a property should command in a competitive
and open market. This definition also requires that the buyer and seller should be willing but
not compelled to act.
Multi-family Housing - A residential structure with more than one dwelling unit.
Obsolescence - One of the causes of depreciation. A loss in value due to reduced desirability
and usefulness because the property does not meet current standards or needs.
Operating Expenses – The term includes all expenses necessary to maintain a property
and/or its income, excluding debt service. For purposes of assessment, property taxes are
omitted.
Parcel - A piece of land under one ownership.
Replacement Cost - The cost to construct, at current prices, an improvement that is equivalent
in utility to an existing structure, using modern building materials and according to current
standards.
Reproduction Cost - The cost to replicate, at current prices, an existing structure, using the
same materials, construction standards, quality, design, etc., as the original structure.
Reserve - With regard to real property taxation, an amount allocated for tax delinquency,
cancellation and abatement of taxes and refunds.
Special Franchise - Cables, conduits, pipes, and other utility property located in or along the
public right-of-way.
Tax Dollar Value of Exemption – The billable exempt value times tax rate. The exempt
value is billable assessed value (or a portion of billable assessed value for partially exempt
properties). Actual assessed value is the product of the assessment ratio applied to market
value. Transitional exempt value is the portion of the value that is phased-in over five years.

69
Prior to the FY2021 report, when the taxable actual assessed value (defined as: Actual AV
minus actual exempt value) equaled the taxable transitional assessed value (defined as:
transitional AV minus transitional exempt value), the actual exempt value was reported.
Starting with the FY2021 report, if the taxable actual AV and taxable transitional AV are
equal, the transitional exempt AV is reported. The reported tax dollar value does not include
Payments-In-Lieu-of-Taxes (PILOTS), which reduce the net tax dollar value of the exemption
for some parcels. For information on PILOTS, please refer to the NYC Annual Report on
Tax Expenditures for the current fiscal year, available at the following web address:
http://www1.nyc.gov/site/finance/taxes/annual-report-on-tax-expenditures.page
Tax Rate - The amount, usually expressed in dollars per hundred of assessed value, applied
to the tax base to determine tax liability. In New York City, a tax rate is established for each
tax class.
Taxable Assessed Value - The amount of assessed value remaining after application of any
tax exemption.
Taxable Status Date - The date on which the assessed value, taxable status and, if applicable,
tax class are fixed for all properties in a taxing jurisdiction.
Transitional Assessed Value - The assessed value, during the five-year phase-in of
equalization changes, of all Class Four properties and cooperatives, condominiums and rental
buildings with more than 10 units in Class Two.
